Check out Optimize, our new AI-powered product!
Media flows in WebRTC
Web-based Real-Time Communication (WebRTC) is a standardization effort between the W3C and the IETF to enable peer-to-peer communication services natively between the browsers. Being able to deploy communication service on billions of devices using a few lines of Javascript is truly amazing and empowers developers to build truly new types of web applications leveraging audio/video.
At this time, several WebRTC SDKs are available and each one delivers a slightly different feature set from the other, however, each SDK is capable of setting up a communication link between two participants. Poor video quality is one of the challenges faced by many WebRTC applications deployed on the Internet. WebRTC transports multimedia encapsulated in Real-time Transport Protocol (RTP) over UDP, consequently, it is subject to the vagaries of the best-effort IP network. They are: packet loss, packet re-ordering, variable queuing delay, buffer-bloated access queues, varying capacity in wireless networks (due to channel fading, interference, mobility), etc. At the momemnt, RTP Media Congestion Avoidance Techniques (RMCAT) WG is developing standard congestion control algorithm for unicast RTP-applications (these techniques are applicable to WebRTC). Also, the circuit-breaker algorithm prevents multimedia flows to cause excessive congestion.
Performance Monitoring
Currently, endpoints can measure performance by using:
-
getStats()WebRTC API for endpoints to locally monitor the performance of the media flows. The proposed metrics exposed by the API are:- loss, RTT, jitter from the RTCP Receiver Reports (RR),
- bytes and packets sent from the RTCP Sender Report (SR),
- transport bytes and packets received and sent,
- ICE candidates and their respective states.
See WebRTC Stats API for exact details. For performance monitoring in RTCP, there is a need for deploying additional metrics than those reported in standard RTCP RR and SR.
-
Middlebox statistics for middleboxes reporting statistics on the aggregate statistics for each media flow that it forwards or transcodes.
-
Chrome browser exposes an easy interface to collect stats without implementing the StatsAPI. A user while establishing or during an WebRTC session can observe the performance of the ongoing session by opening another tab pointing to
chrome://webrtc-internals/. At the end of the call, the user is able to export the logs, send it by email to the service provider (WebRTC or ISP) for analysis.
Callstats.io is a complete solution to measure the performance of media flows. The client libraries collect local and remote metrics at each endpoint, push these metrics to callstats.io, where it is aggregated and summarized. To quantify the user quality of experience, callstats.io takes into account, the application settings, prevailing network conditions. Furthermore, the algorithm takes each participants involved in the conference to gauge the overall quality of the conference. Lastly, callstats.io aggregates service-level statistics that are important for the operation and maintanence of a WebRTC service.
Measurement Architecture
The figure shows the overall architecture: the endpoints, middlebox (e.g., TURN server, conference server) and the WebRTC signaling server are typical entities in a WebRTC service. Performance monitoring requires each endpoint tosend measurement metrics to a monitoring server (callstats.io backend), which collects, aggregates and summarizes these metrics to create Service-level, conference-level and flow-level statistics. If possible, metrics for middleboxes should also be aggregated to help diagnosing potential performance issues.
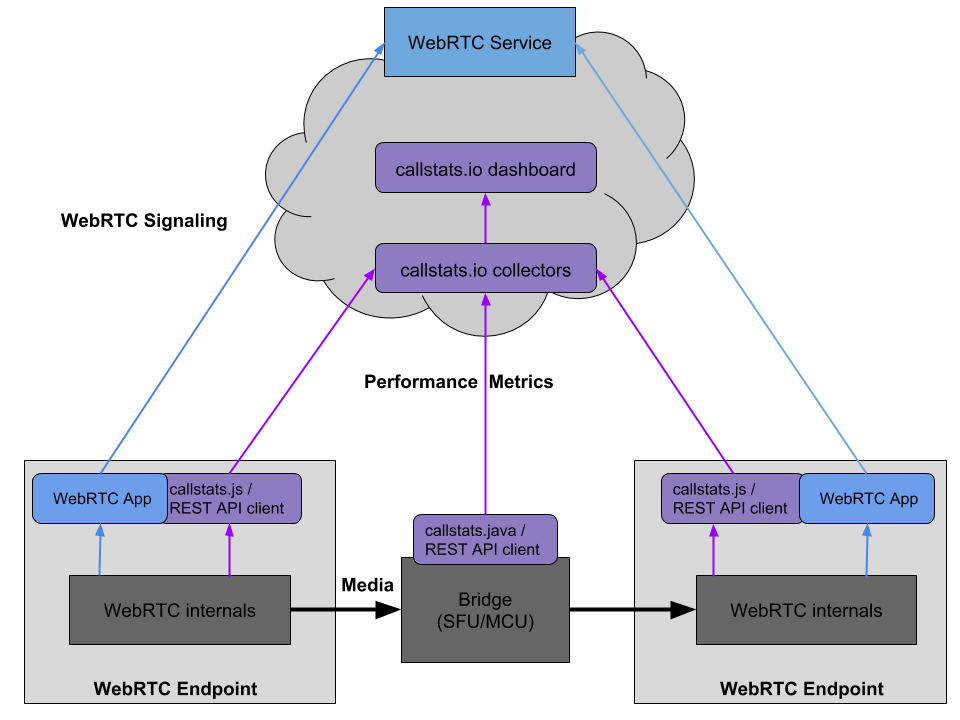
Figure 1: callstats.io architecture and information flow
We currently provide the following components to perform and observe measurements:
callstats.js, a javascript library.callstats.java, a java library.REST API client, a REST API for native clients.Dashboard, where a service provider is able to view the health of their deployment.
More components are planned and announcements will be made on our blog.