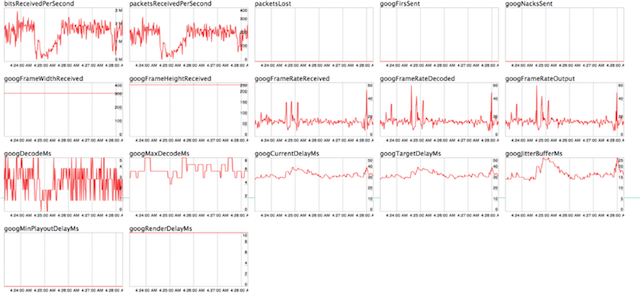
webrtc-internals† allows participants to locally observe the performance of the WebRTC connections. The page reports on several network and media statistics (such as packet loss, frame rate, and bitrate, etc.). We have seen that several WebRTC services ask their users to export the logs from webrtc-internals and send it to them for further analysis.

Figure 1 shows
webrtc-internalsstatistics captured by a user in their endpoint at the end of the call. Typically, these logs need to be exported, sent via email to the WebRTC service so that they can diagnose the problem and deploy a fix. While useful, this technique does not follow the DRY principle and is neither scalable.
Using the webrtc-internals requires the user to be quite tech-savvy as only few people know how to access the page. Also making the user go to the webrtc-internals page makes the users do a job that should be done by the service provider. Another issue we observe with this strategy is that once the service provider has identified the issue, does the service provider know how prevalent the issue is? Also, it is difficult to know if the fix should be deployed for a subset of users or for everyone using the service.
With callstats.js integrated in WebRTC service, statistics from every call is periodically logged. Therefore, a developer can dissect segments of a conference call or also search for conference calls made by the same user to see how consistently the issue appears for them.
Apart from aggregating the quality across calls, callstats.io dashboard visualizes the service’s usage data. It currently provides the following level of detail:
- Application level
- Number of calls: successful, failed, relayed.
- Average of call durations
- Average setup time and other annoyances
- Call quality based on transport and multimedia metrics
- User feedback about call quality (see our other blog post)

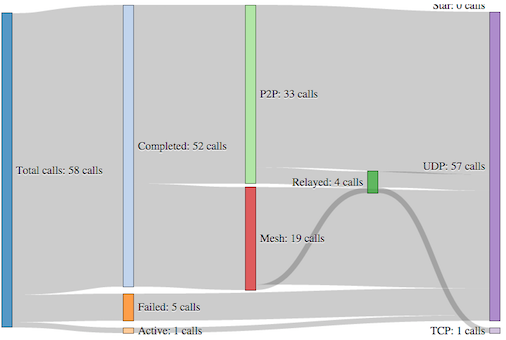
Figure 2 shows the distribution of failed and completed calls and if they were peer-to-peer, a mesh of multiple participants, and if those calls were over UDP or TCP.
- Search exposes conference level statistics (timeseries)
- Plots of transport metrics (variation over time)
- Events (joining, leaving, muting, pausing, …)
- Media quality metric per participant

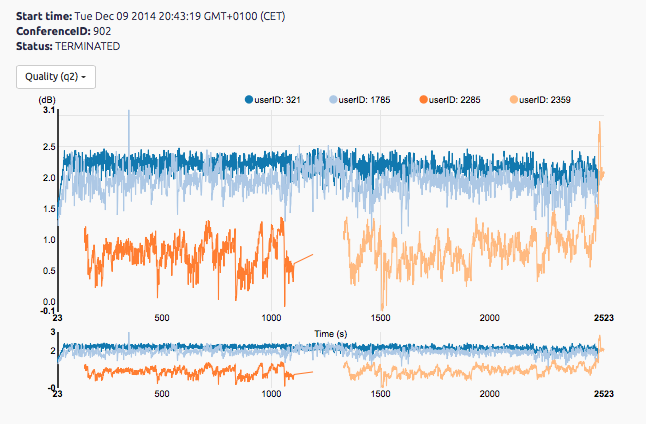
Figure 3 shows a total of 4 participants in a call, one participant logs off and a new one joins in. The timeline shows that two participants receive relatively comparable media quality while the others (shades of orange) have poorer quality (by a factor of 10).
There is a lot in works and we are continuously refining the dashboard, working out what visualizations work best for service and deployments. If you are excited about dashboards, visualization, and stream analysis – look at our jobs page.
Additionally, we are working on notifications and diagnostics to help WebRTC services refine their deployments. We also have bindings for analysing at TURN servers, conference bridges, or similar middleboxes.
Drop us an email, if you are interested in integrating callstats.io with your WebRTC service.


