WebRTC is an HTML5 API defined in the W3C that supports plugin-free video and audio calls between browsers. WebRTC traffic is transported over the best-effort IP network, which by nature is susceptible to network congestion. Typically, congestion in the network increases latency and packets may be lost when routers drop packets to mitigate the congestion, burst losses and long delays affect the quality of the WebRTC media stream, thus lowering the user experience at the receiving end. To make sure WebRTC calls can be offered at the best possible quality, the standard includes a real-time statistics API.
There are two ways to access the WebRTC statistics: opening the webrtc-internals page in the browser making the call (works on Chrome and Opera) or using the getStats() API call. In this article we will go through the basics of the WebRTC statistics API and go through a few metrics that a developer can use to get started with WebRTC statistics.
Media Pipeline
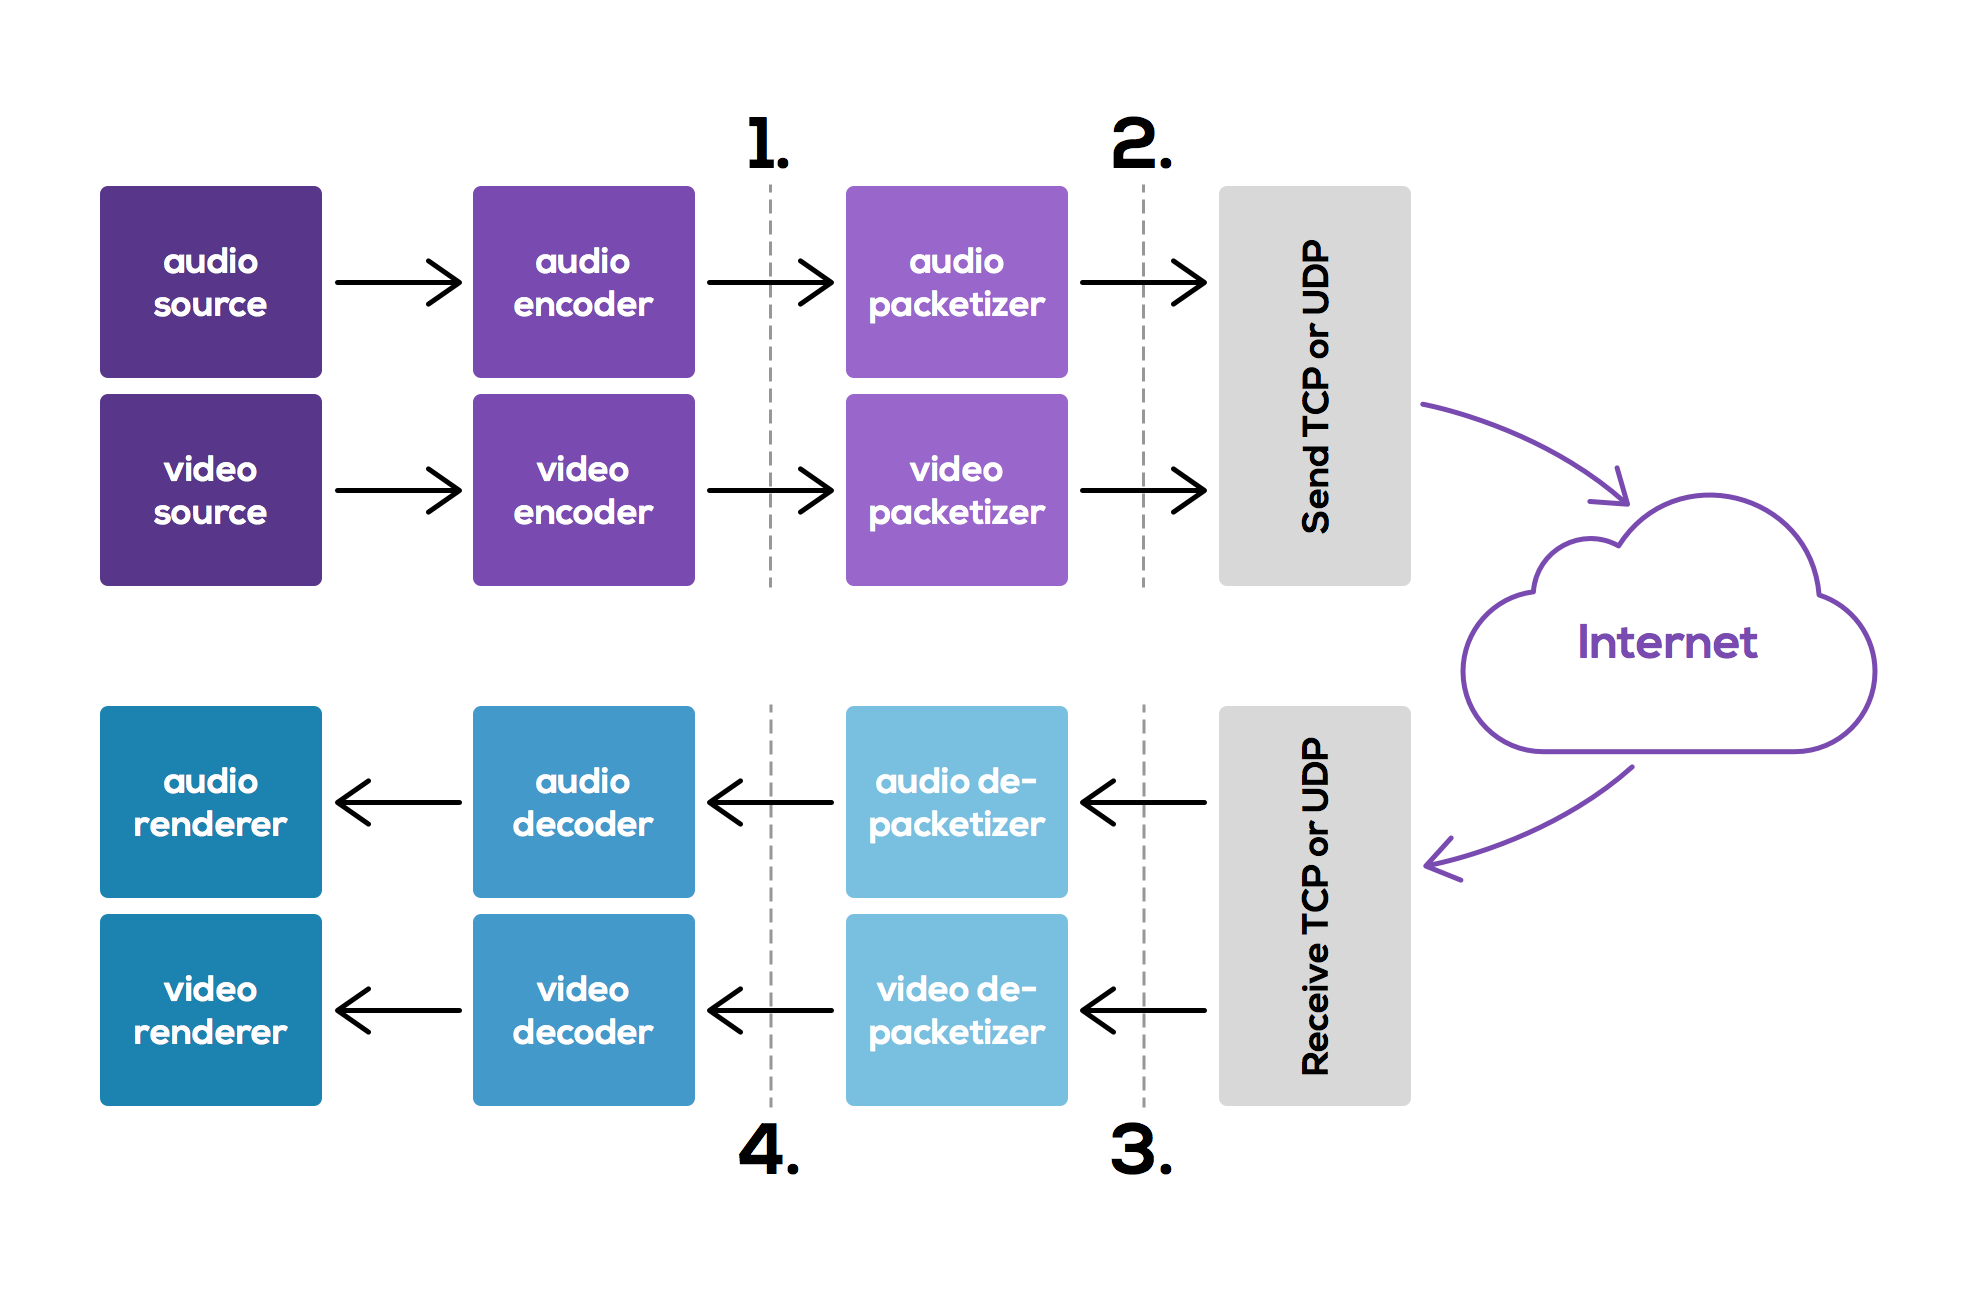
Media capture, transportation, reception and playback is usually a very well structured process and data typically undergoes change at each stage, these changes need to be measured. A typical media pipeline is shown in Figure 1. where a audio and video is captured at regular intervals by a microphone and camera, respectively. The raw media frame is then compressed by an encoder and further packetized into MTU (maximum transmission unit ~1450 bytes) before the packets are sent over the Internet. The endpoint on receiving these packets, concatenates these into frames, complete frames are then sent to the decoder and finally rendered. Some implementations may discard incomplete frames, or use concealment mechanisms to hide the missing parts of the frame, these may have varying impact on the quality of experience.

Structure and flow of the WebRTC data and statistics API
Structure of the API
The getStats() API is structured as follows:
-
Sender media capture statistics: corresponds to the media generation, typically frame rate, frame size, clock rate of the media source, the name of the codec, etc.
-
Sender RTP statistics: corresponds to the media sender, typically packets sent, bytes sent, round-trip-time, etc.
-
Receiver RTP statistics: corresponds to the media receiver, typically packets received, bytes received, packets discarded, packets lost, jitter, etc
-
Receiver media render statistics: corresponds to the media rendering, typically frames lost, frames discarded, frames rendered, playout delay, etc.
Miscellaneous information in the statistics object
-
Datachannel metrics: corresponds to the messages and bytes sent and received on a particular datachannel.
-
Interface metrics: corresponds to the metrics related to the active transport candidates. For example, if the network interface changes from a WiFi to 3G/LTE on a mobile device, or vice-versa. The active interface also carries the network related metrics: bytes, packets, sent or received on that interface, and the RTT.
-
Certificate stats: shows the certificate related information, for example, the fingerprint and current algorithm.
Some core metrics
Frame inter-arrival, or jitter is one of the core measurement metrics, since the frames are generated and sent periodically, it is reasonable to expect them to arrive periodically. Due to the presence of other traffic in the network, the packets may not only arrive out of order, but also arrive at varying intervals. In an audio call this may cause the syllables to elongate or be abruptly cut-off. If video is involved, this may result in loss of lip synchronisation (audio and video are out of sync).
Packet losses and packet discards: packets may be lost in the network, i.e., they never arrive. Communication applications require fluidity, this means that the frames need to be decoded in time to preserve interactivity. Hence, frames that do not arrive in time to be decoded are often discarded even before decoding. In both cases, the decoder needs to compensate for the missing packet, either by applying concealment or just decoding as is. This may cause pixelation or a black screen for video and in audio speech may appear to skip.
For example, the endpoint can parse the output of the getStats() query result for the inbound RTP statistics to get the jitter, packetsLost, and packetsDiscarded.
Example for Simplified E-model
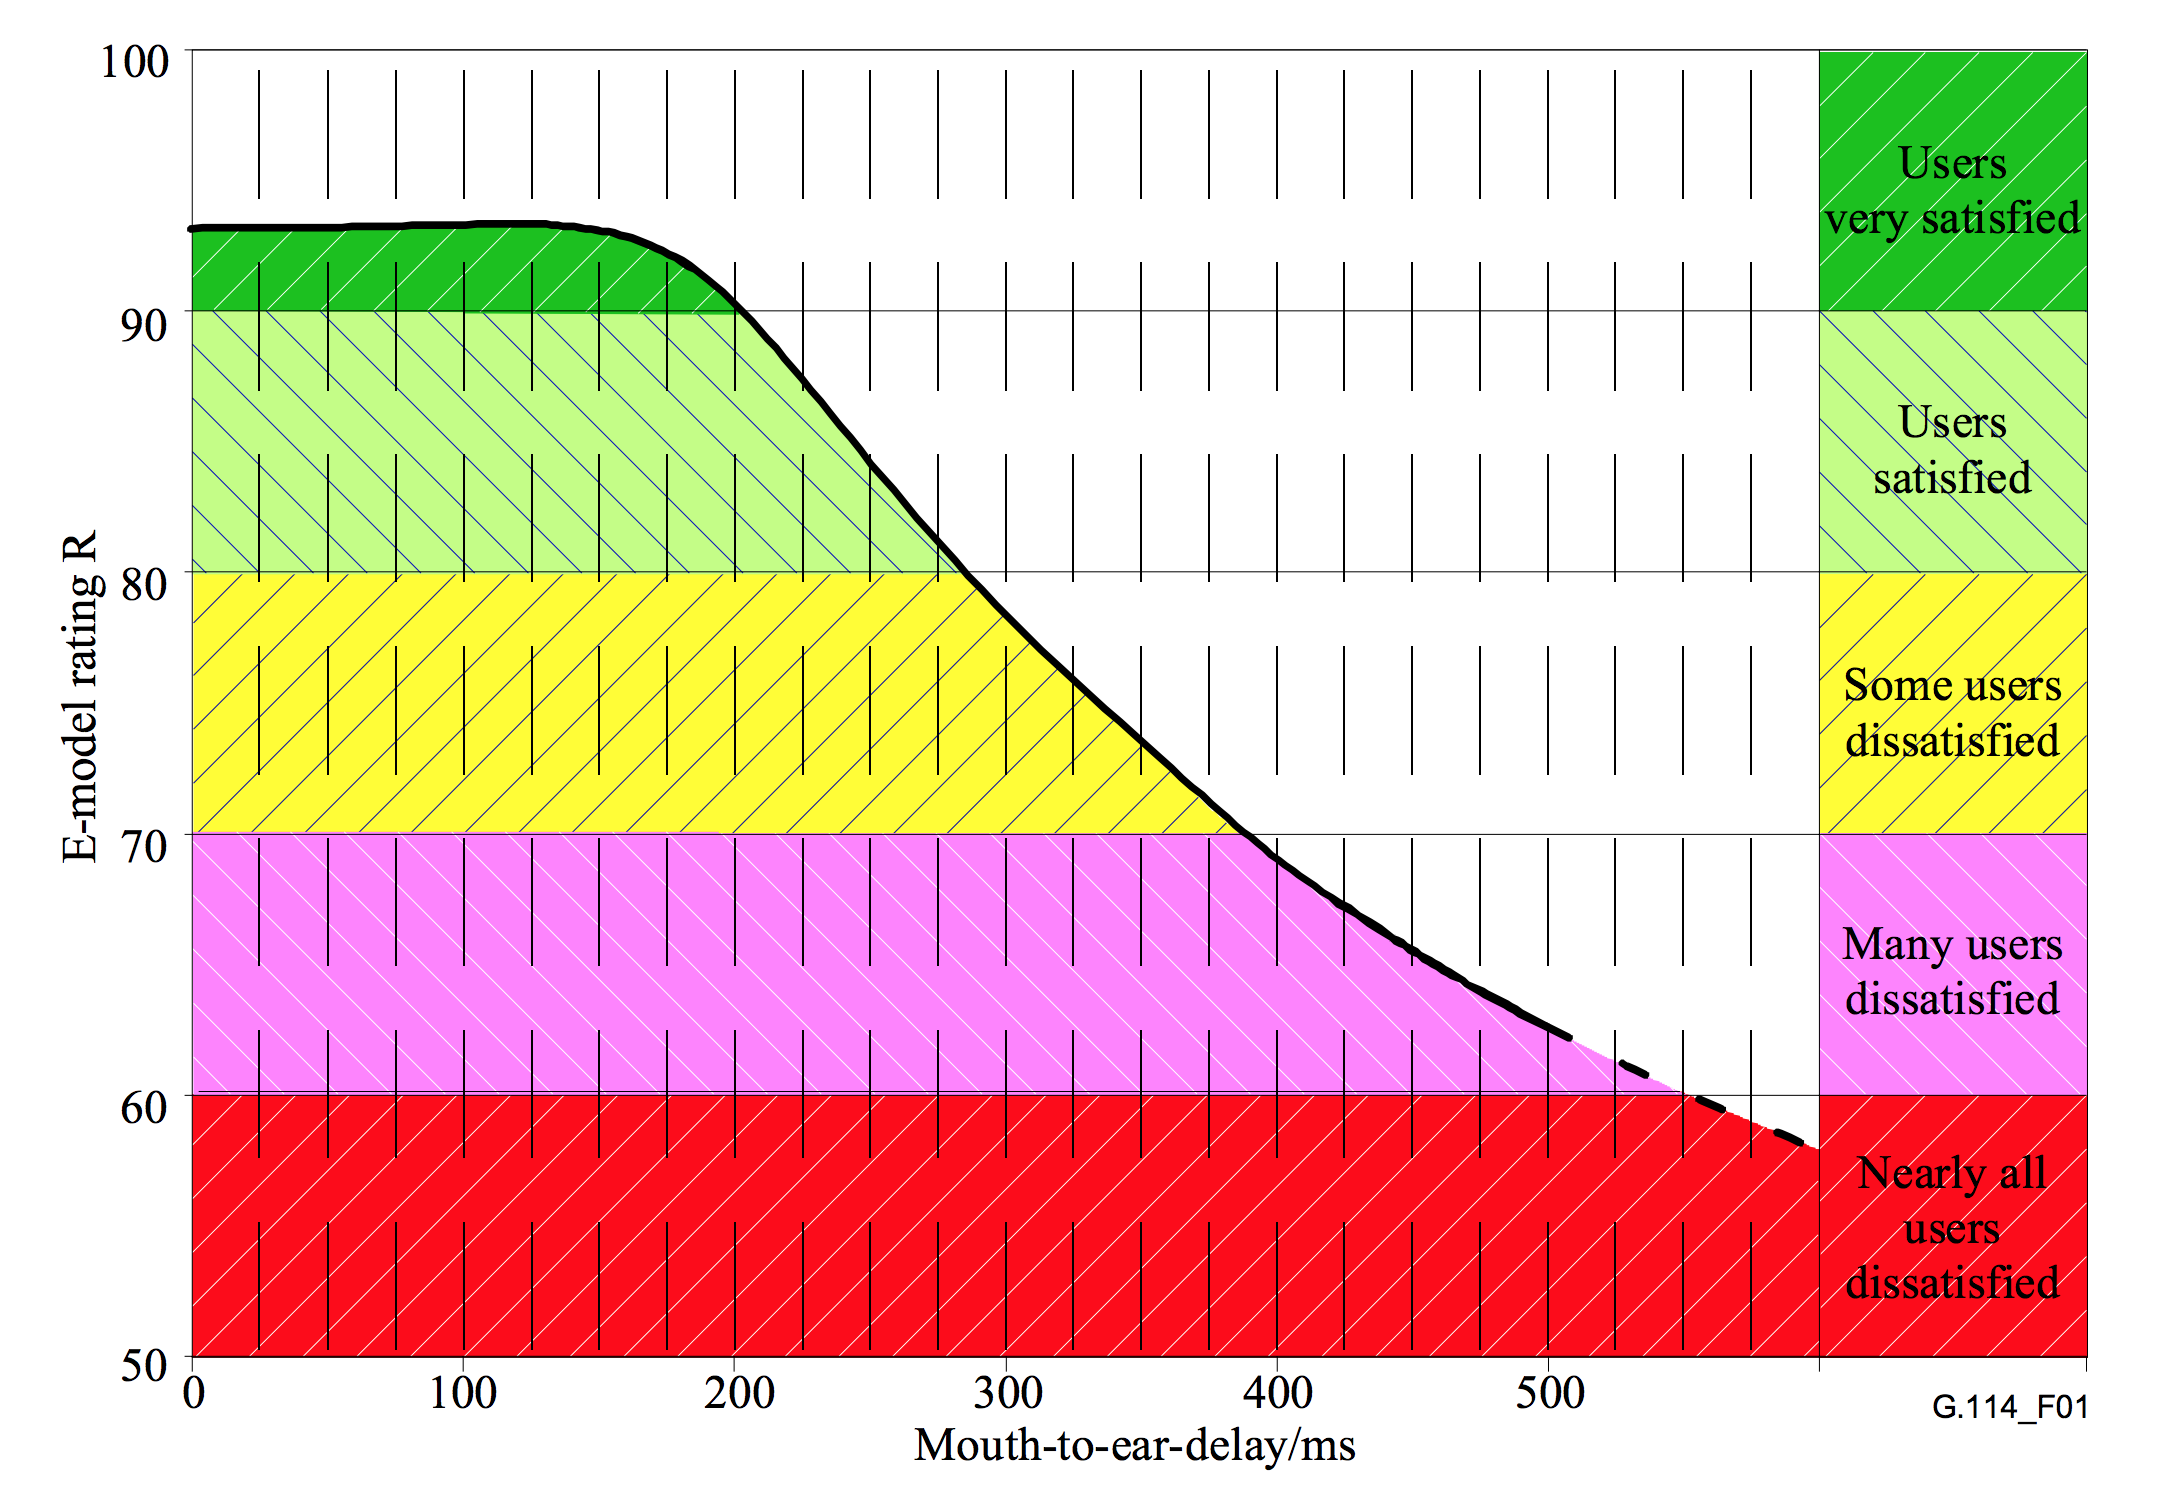
In the below example, the sending endpoint uses the RTT measurements to calculate the average one-way delay and maps the calculated value to the mean opinion score, which is based on the user’s perception of call quality. The simplified e-model is described in Figure 2.
var selector = pc.getRemoteStreams()[0].getAudioTracks()[0];
var rttMeasures = [];

// ... wait a bit
var aBit = 1000; // in milliseconds
setTimeout(function () {
  pc.getStats(selector, function (report) {
    for (var i in report) {
      // the below parsing may not work correctly in any browser
      // as they have differing implementations.
      var now = report[i];
      if (now.type == "outboundrtp") {
        // this is an example based on mid-2015,
        // the object returned by stats API
    		// use googRTT for chrome/opera or mozRTT for firefox.
        // the objects are expected to change, the standard is documented at:
        // http://www.w3.org/TR/webrtc-stats/
        rttMeasures.append(now.roundTripTime);
    		var avgRTT = average(rttMeasures);
        // this is a very simple emodel and does not take
        // packetization time, or inter-frame delay metrics into account.
        // You may calculate the e-value at each sample
        // or at the end of the call.
        var emodel = 0;
        if (avgRtt/2 >= 500)
           emodel = 1;
        else if (avgRtt/2 >= 400)
           emodel = 2;
        else if (avgRtt/2 >= 300)
           emodel = 3;
        else if (avgRtt/2 >= 200)
           emodel = 4;
        else if (avgRtt/2 < 200)
           emodel = 5;
        //console.log ("e-model: "+str(emodel));
      }
    }
  }, logError);
}, aBit);

function average (values) {
  var sumValues = values.reduce(function(sum, value){
    return sum + value;
  }, 0);
 	return (sumValues / values.length);
}

function logError(error) {
  log(error.name + ": " + error.message);
}

E-model rating correlation with audio delay in WebRTC calls presented per MOS category. Example image and data from ITU’s T-REC-G.114.
As the example above shows, the WebRTC statistics API contains powerful metrics that can be utilised in any WebRTC service. Even so, to reap the full benefit of the metrics provided by the getStats() and collecting finegrained timeseries of a conference/call requires a lot of resources (to collect and organize the data, and run diagnostics). Starting from scratch to gather data and turning it into information will take a lot more time and effort than building the actual WebRTC application.
That is the primary reason we built an easy way to perform analytics on WebRTC media. With just three lines of code any developer can integrate callstats.js into their WebRTC app and immediately start analysing a specific conference call, or observe the aggregate metrics on the dashboard. Additionally, the callstats.io service offers a propietary quality metric for audio and video quality that is not part of the WebRTC statistics API. Chiefly, instead of looking at the raw metrics, the quality metric models the raw network and media metrics into a quality of experience metric.
If you are interested to give callstats.io a try, we now have a free developer plan. You can sign up here. If you are excited about network diagnostics or organising large amounts of data, please look at our job listings.


