When a person (repeatedly) drops out and rejoins a conference due to network connectivity problems or media pipeline misconfigurations, it is called “user churn”. We are investigating churn more closely at callstats.io, and the first step was to develop some simple metrics to measure churn within a conference. We measure user churn by checking whether a particular user joined the same conference repeatedly.
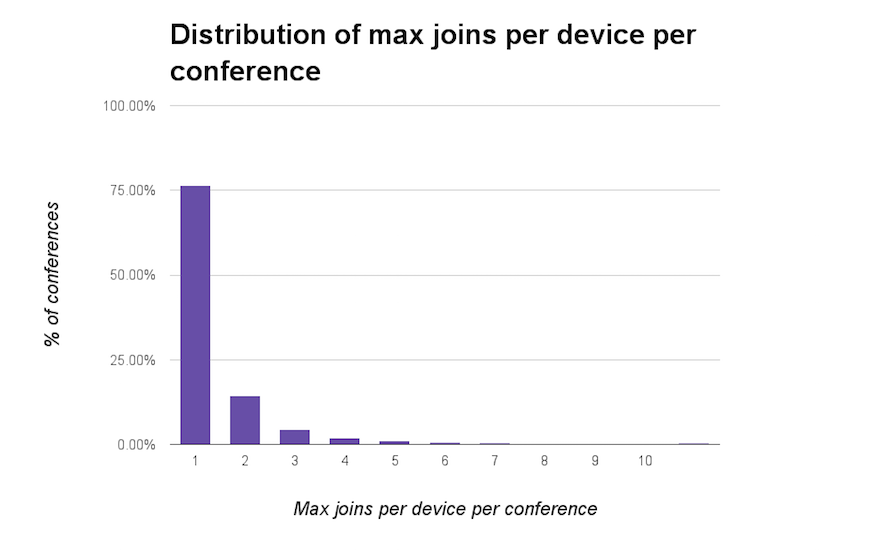
The first question we asked was: “How many times might a single user join a conference?” The figure below shows a distribution of maximum number of joins per user per conference. We can see that 76% of conferences have maximum of one join per user which means that these conferences had no churn. Note that measuring only the number of joins per user may give a false-positives since it might be that a user leaves and rejoins the same conference later, however, if there are no repeated connection attempts in the intervening periods, these users are ignored by churn.

Maximum number of joins per device per conference.
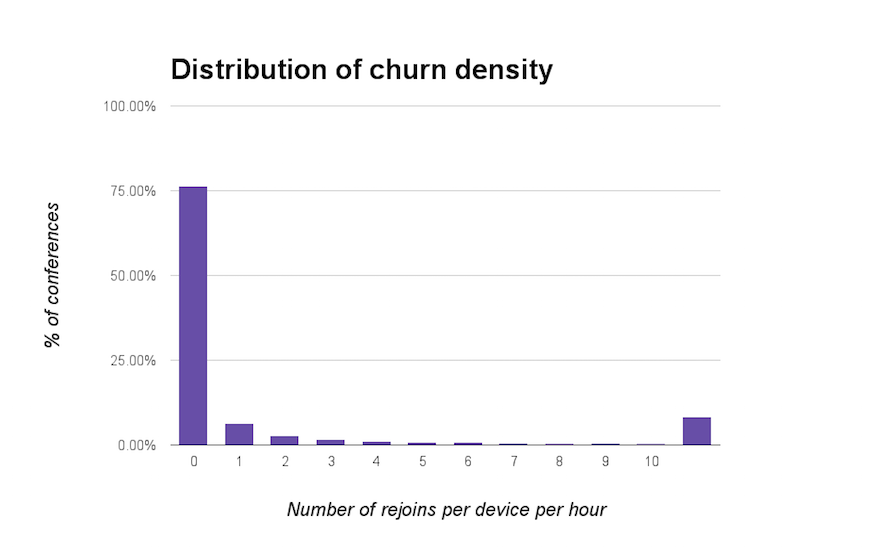
The second question we asked was: “How often do users rejoin?” The figure below shows a distribution of average rejoin frequency in a conference i.e. number of rejoins per user per conference length in hours. As already noted in the earlier figure, 76% of conferences have no churn. Although, 6.3% of conferences have an average frequency between zero and one. The last frequency bar includes the conferences with an average frequency greater than ten rejoins per hour. We have to investigate these conferences more closely as most likely these conferences that have failed completely.

Number of rejoins per device per hour.
To give this information to our customers, we will be adding churn metrics to the dashboard during this fall. To stay tuned for future product updates, subscribe to our newsletter or subscribe to our RSS feed to get our blog posts.


