Performance monitoring is an important aspect of system and service development, it helps detect and diagnose performance issues and assists in maintaining a high availability. Engineering teams nowadays make data-driven decisions, and these performance measurements play an important role in implementing and deploying the right fixes.
Typically, service monitoring metrics fall into two categories:
- Scale: load of the system, failure rates, churn, etc.
- Duration: time to set up, respond to a transaction.
WebRTC is no different when it comes to metrics. A good example for a “scale metric” is the number of simultaneous ongoing conferences or number of failed conferences, and correspondingly an example for a “duration metric” is the time to set up a connection.
Measuring in real-time
At callstats.io, we embrace real-time in everything that we do. We begin categorizing the conference as soon as the first participant joins the conference. If a conference fails to set up, the service will immediately know that it failed, the failure reason, and how long from the start of the conference did it take for it to fail (for example to discern if the user was patient or impatient.). Being able to do this in real-time is a critical aspect of our philosophy; it enables sending alarms as soons as things happen and the dashboard updates itself immediately! We call this “continuous analysis”.
Doing it right: End-to-end Monitoring
Callstats.io passively monitors every important aspect of every WebRTC connection (via the getStats() API or infrastructure metrics), i.e., these are metrics from real users (only our customer know who they really are). The methodology is to measure:
- The network performance of the path between each pair of WebRTC devices.
- The media performance at each WebRTC device. This covers a slew of metrics related to the playback and rendering of the media streams.
These metrics are independently aggregated for each connection, participant, and conference.
Failures
The magnitude of any metric varies on a day-to-day basis due to diurnality (user behaviour, associated to the time of day, or day in the week). However, a significant drop in usage compared with previous days or weeks may indicate an issue with the service.
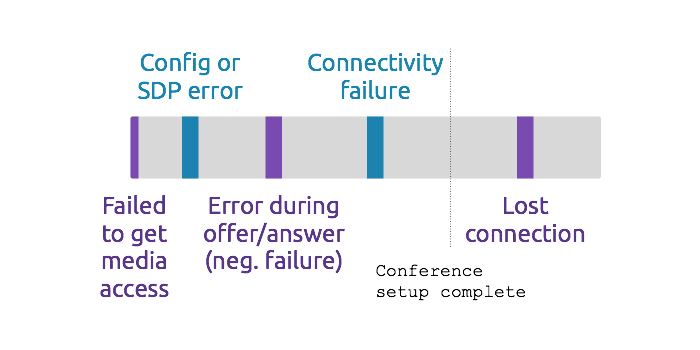
For example, an increase in call set up failures can indicate a failure of the infrastructure, endpoint, or (in some cases) the network. The below figure shows when various errors can take place during a conference call. More details about detecting and categorizing connections is covered in detail in an earlier blog post.

Category of errors during conference setup
Reasons for failures in the WebRTC service components:
- The endpoints may change their behaviour. A new browser update arrives every 6 weeks, the dev and beta versions are available prior to that. Hence, the development teams have an intuition of new features and upcoming changes that could cause problems. Furthermore, the Chrome and Firefox teams announce PSAs in advance and answer support queries promptly.
- The infrastructure may be overloaded, i.e., the servers are experiencing more traffic than expected, leading to performance issues. This may also occur if the underlying infrastructure disappears, or a rollout of a new feature causes a behaviour that affects a subset of the customers.
- The network may be congested, is policing the Internet traffic, or behaves non-deterministically. This may be limited to a certain geography, or a particular Internet Service Provider/enterprise network. Typically, in these cases the user is behind a restrictive firewall or has a faulty network equipment.
Outage
A service outage can happen when one or more components of the WebRTC service’s infrastructure stops working:
- Signalling server is down: results in no calls being set up. In this case, there will be a drop in the number of ongoing and total conferences.
- TURN server is down: results in some calls being set up. In this case, there will be an increase in the partial or total conference failure, and categorized as ICE connection failure.
- Conferencing bridge is down: some calls are set up. One or more bridges will report a failure.
It is equally important to indicate these errors to the user of the service. For example, telling to the user that they lost network connectivity either to the signaling server or the conference bridge, that the session is being re-attempted, or it has failed and they should wait a moment or immediately try again. Many services already provide basic diagnostics like: voice meters, network bitrates, mute indications, etc.
Similarly, our API exposes network connectivity status, and other key metrics. These can be surfaced to the end-user in an appropriate user interface to help them understand the application’s current status and ease possible frustration of diagnosing the outage.
Gathering End-user feedback
Gathering feedback from the end-user is also very important. It helps correlate the end-user’s experience with the objective quality (or media and network metrics). Across callstats.io customers, we see between 10-40% of the conferences have one or more user feedback comments. The feedback volume depends a lot on asking the right question in the correct context.
Continuous Testing
In the industry at large, automated testing or continuous integration is the norm. This is also available for WebRTC. The browsers have championed an effort to automate this process. See: “TestRTC”, continuous testing, and conformance testing. Additionally, there are several resources on Github on using Selenium for WebRTC testing.
Summary
In our opinion, the best way to do end-to-end monitoring for WebRTC is to integrate the monitoring solution to the core of the WebRTC application with APIs. With this approach the monitoring solution is able to track the scale and duration metrics in real-time giving the developers timely information about the state of the WebRTC service. An API powered solution also offers many callback possibilities, for example, to automatically adjust the performance of the WebRTC application to offer the best possible media quality to end-users every time.
Other reading material: Slidedeck: Monitoring WebRTC.
Addendum (24/02): Added a section on testing, because some people reached out asking about how to automate browser testing.


