Many stars must indeed align for teleconferencing to be successful: End-to-end connectivity is arguably one of the most crucial ones, especially given how your users will likely operate with a variety of different network contexts. For users who e.g. have a private IP address, Network Address Translation (NAT) is used to route data and establish endpoint connectivity. The Interactive Connectivity Establishment (ICE) framework is a prominent example of a NAT traversal technique.
To help keep a better eye on your ICE stats, we recently introduced ICE data visualization for our Pro and Enterprise customers. In this blogpost, we explain how to make the most out of ICE tables in your dashboard.
So, when you detect a call failure, how to go about debugging it, using ICE data?
New panel: ICE Data Table
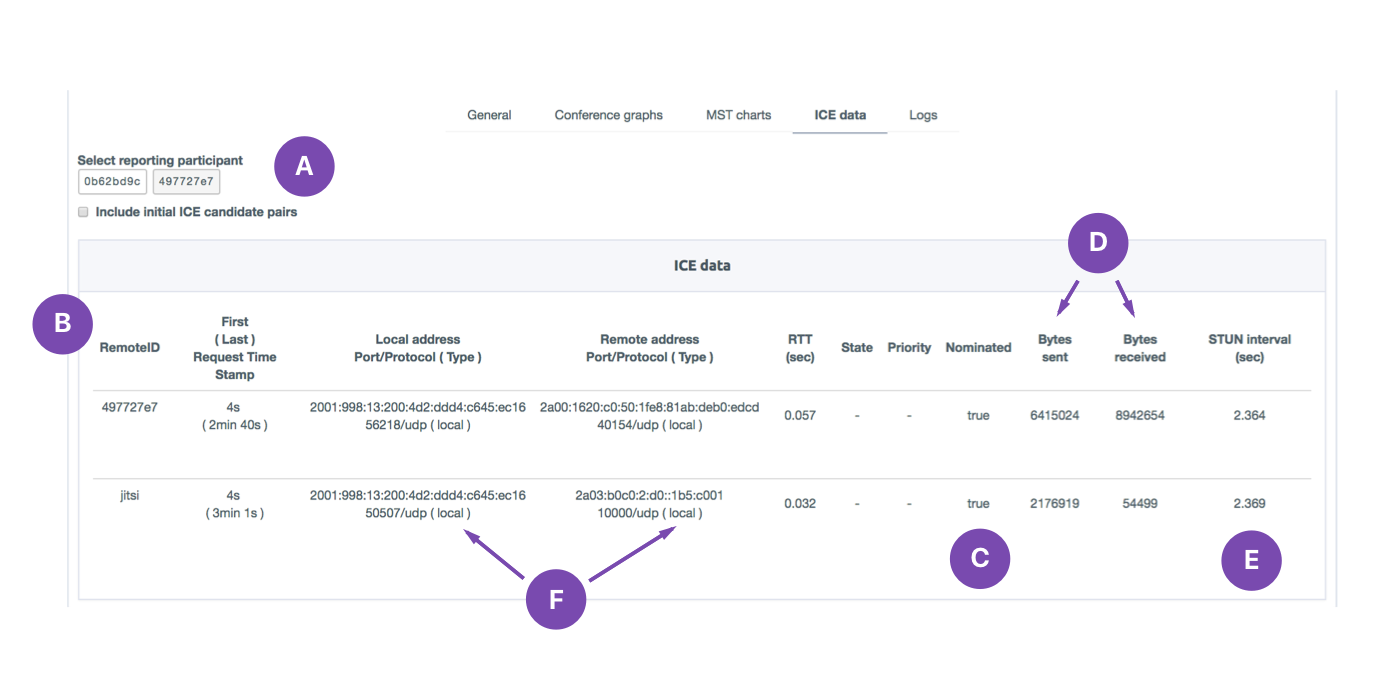
The new ICE data feature gathers data for all the local and remote candidates in one table. You can find it on the conference level page in the “ICE data” tab for each conference.
When you select a userID, the corresponding remoteID and the candidate pairs are shown on the table. The corresponding rows will show several candidate pair properties including the state and whether it was nominated (used).
This table would be used, for example, in detecting 3G to WiFi handovers or in evaluating your TURN server’s performance. Like, if some of the relay candidates are performing poorly, then it’s time to check your TURN server’s performance.
On the left corner of the ICE data table, there’s a checkbox called “Include initial ICE candidate pairs”, where you can review all the proposed transport pairs that were not used during the transport.
What can we then observe, looking at the ICE table? Below, we’ve highlighted some notable information on the ICE data panel.

A: These ICE candidates were proposed at the beginning of the conference, but they were not “nominated” and no data was sent through to them B: This is the party the reporting participant was communicating with C: This was the last candidate used during the communication D: Amount of data exchanged through each candidate during the conference E: How often STUN packets are sent to maintain the connection (NAT binding) F: Type of candidate
Understanding Your ICE Status
The ICE data table is a useful tool for understanding multiple ICE connectivity related scenarios, including
- Failure: When no connectivity is established
- Established, but fails
- Re-establishment of calls
Next, let’s zoom in on these categories.
Failure: When there is no connectivity, you can check the ICE data to see whether the end-users received any host, server reflexive, peer reflexive or relay candidates. If you have configured a TURN server then you should see candidate pairs of type “relay”.
Established, but fails: In certain cases, there is connectivity but network disruptions can cause connections to fail. The end-points will choose another candidate pair that is in the succeeded state from the gathered set of candidate pairs and start using them based on the priority. The newly selected candidate pair’s “nominated” field will be set as “True” to show that it was the last used candidate pair.
Re-establishment of calls: Connection re-establishments can be caused, for example, due to handovers. You will be able to see the candidate pairs changing from mobile network to WiFi. This way, you can inform the customer about the disruptions in the calls due to hard handovers.
Identifying Connectivity Failures
Besides ICE stats, callstats.io provides metrics on connectivity failures on multiple levels. Conference setup failures, often due to impermissive NATs and firewalls, are amongst the most common and irritating errors we see across apps. We categorize these errors into three main categories:
- Media source related
- Negotiation related
- During NAT/firewall traversal
Read more about conference setup failures in this blogpost.


