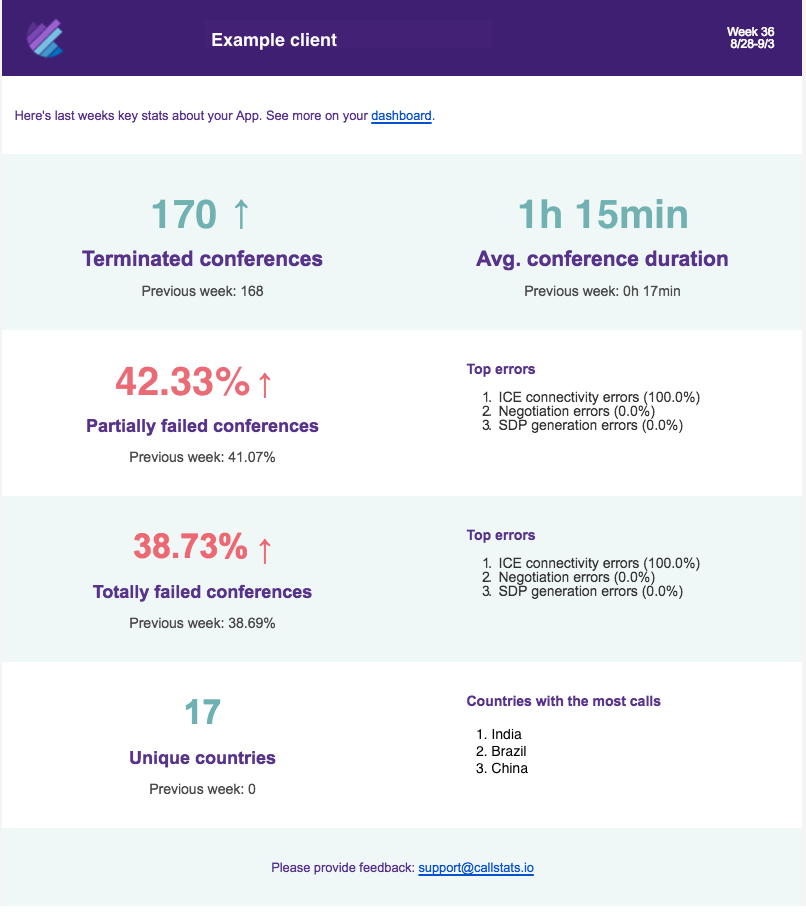
We’ve recently introduced Weekly App Stats, an email report that summarises your app’s performance over the week. You can follow your app trends and stay alert, all from the convenience of your email inbox.
Monday Monitoring
This new feature means that every Monday, all App level Admins are sent a week long recap of the most important statistics of your app.
The weekly report will address the following topics:
- The health of your app
- Failed conference stats
- The most common issues in the app
- Location and distribution of your app users
These key stats help you keep an eye on your app’s performance metrics, assists you to spot potential issues before your week starts and bring them up your internal team meetings.
To start receiving your Weekly App Stats, create an account today.
How to read Weekly App Stats?

The email opens with a comparative look on terminated conferences and average conference duration.
The second part of the weekly report focuses on errors and geographical distribution. Again comparative to the previous week’s performance, Partially failed conferences shows how many conferences failed to establish for some participants. The right hand side captures the week’s 3 most common error categories.
Below, the segment on Totally failed conferences highlights the three leading causes and the number of conferences that failed to establish alltogether in the previous week.
Finally, the last segment focuses on geographical distribution, which is something many users like to track on callstats.io. The left hand side shows the number of unique countries


