Data is at the heart of what callstats.io does: We detect and diagnose issues based on the data we collect (via libraries callstats.js, callstats-android* , callstats-ios* or the REST API) from our customers. The callstats.io service is delivered as a Software as a Service (SaaS) and the collected customer data is completely insulated from each other. In this post, we explain how the service collects data, how we approach visualizing it, and what is the thought process behind our current and future features for the dashboard.
Data Organization
callstats.io collects data at regular intervals from every endpoint (usually identified as UserID) in a call (identified as ConferenceID). These endpoints may be web or native end-user devices or media-aware infrastructure, such as relay servers, SFUs (Selective Forwarding Units), MCUs (Multipoint Control Units), or media servers/gateways. The library collects data from various parts of the media and networking pipeline: on the sending side, from capturing, encoding, packetization and transmission, and on the receiving side, from receiving, reordering, decoding and rendering. This means that we are able to capture and correlate any glitches in the system.
In addition to the measurement data of the media and networking pipeline, callstats.io also collects events: these events may be end-user interactions (such as mute, hold, hang up, or screen sharing), or events from the media and network pipeline (loss in connectivity, new user joining, active speaker, etc.). Since we collect data from each endpoint in the call and not to be overwhelmed by the vast amount of data, we analyse the data stream in real-time i.e., be able to correlate and identify cause and effect for situations in the call (e.g., users dropping out, media quality or rendering issues, etc).

The top down data pyramid
Data Aggregation (Bottom-Up)
We collect all pertinent data to make good diagnosis and we keep an eye out for interesting APIs that could help detect more accurate.
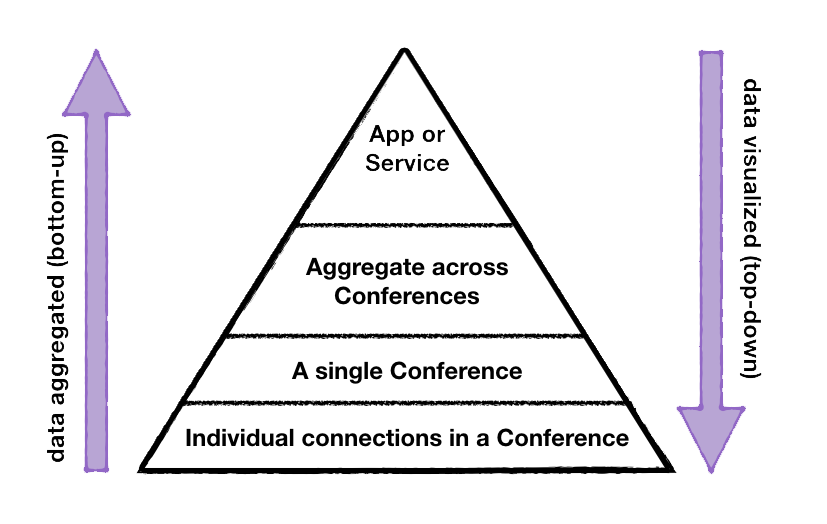
That said, the data aggregation framework at callstats.io has remained unchanged since our early days. Our data analysis approach is bottom-up, i.e., we start with analysing and correlating each individual in a call. Thus, at the end of the call, we have a summary for each participant, connection, and a score for the complete call. We do that for each call, and this summary data can then be aggregated across calls in for example, a region, time span, or by similarity. Further, at the top of the pyramid, we have a bird’s eye of the application/service performance, which aggregation of all the data for a particular app.
In essence, we think of data collection at callstats as a pyramid of sorts, with individual call data at the bottom of the pyramid. As we go up the layers, the data gets aggregated in stages into a holistic view for your WebRTC App or Service.
Data Visualization (Top-Down)
In contrast, our data visualization and presentation approach is top-down: in the Service metrics tab, we start with the birds-eye view of the service and then work our way down to an individual call. Hence, at the top is the app/service performance, currently visualized as a time-series in hourly/daily/monthly bins. At the lowest is level, on the Conference details tab, is the ability to analyze and diagnose issues in a conference call (e.g., here is an example of how objective quality helps in diagnosing issues in a particular call).
And this is just the beginning: we are continuously working on ways to visualize the information in more meaningful ways. Right now, we are working on the middle layer of the pyramid. In the coming weeks, we are unveiling more of the middle layer of our top-down approach, which shows aggregated metrics similar to the service level results for a particular UserID or ConferenceID query. Aggregation of the search filter was released earlier this year and the ability to slice and dice calls by various features (time, regions, versions, reported issues, quality, user feedback, network and media characteristics, etc) is upcoming.
Privacy & Compliance: Privacy first
Finally, a note about data privacy. Supporting and complying to your data privacy needs is of paramount importance in our data operations. We allow our customers to store their end-users’ data in specific regions to comply with regional regulations and user data protection laws. Furthermore, the upcoming General Data Protection Regulation (GDPR) harmonizes the end-user data privacy law across Europe, including the way in which we handle Personal Identifiable Information, such as IP addresses. If your service or platform requires additional compliance, such as, Children’s Online Privacy Protection Act (COPPA) or Health Insurance Portability and Accountability Act (HIPAA), reach out to our sales representatives.
*callstats Android and iOS are 3rd party implementations. We thank the team at Nanameue for making their work available to others!


