
Occasionally, our customers ask us to help them understand some media quality characteristics and deviations in their WebRTC data. Many properties of WebRTC metrics affect media quality, so understanding the causes of changes in media quality requires a multivariate analysis. In December we published the WebRTC Metrics Report 2017/03, and upon review our customer found that their round-trip times (RTT) distribution was higher than the values in the report. We used our Anomaly Detection System to examine our customer’s data, which applies various analytical techniques to understand why their RTT was not up to par. In this blog post, we discuss the promising early results that the system uncovered.
Meet Navid Khajehzadeh, the engineer building the analytics system at callstats.io. In the upcoming months, he is going to defend his PhD in (Electrical Engineering and Automation) at Aalto University on Analytical Techniques for Rapid Mineral Identification.
Customer Setup: P2P4121 Infrastructure and Global Availability
Our customer uses P2P4121, which means they use pure P2P when there are two participants in a call. Consequently, they use the server infrastructure when there are more than two participants in a call or the participants are behind a restrictive NAT or firewall. This is becoming a popular choice in the industry to reduce server costs. Our WebRTC reports show that, of products that offered multiparty conferences, about 50% of the calls have only two participants.
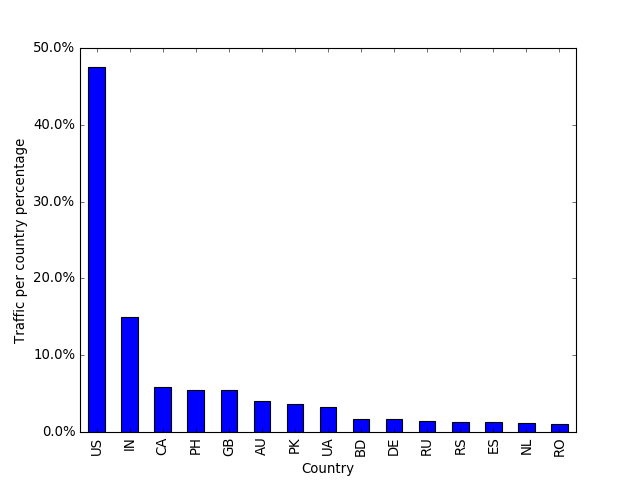
Figure 1: Video and audio call traffic by country.
The customer’s service is offered globally, however, close to 80% of their calls take place in the United States, India, Canada, the Philippines, and Great Britain.
Does RTT Between End-Users Vary Significantly By Geography?
To help our customer understand why their RTTs are high, our Anomaly Detection System identified clusters of countries based on the RTT. We use the ITU-T standard to define the operation threshold for media RTT.
Table 1: RTT thresholds defined by ITU-T for Video
| Low | RTT < 240 ms |
|---|---|
| Medium | 240 ms < RTT < 400 ms |
| High | 400 ms < RTT |
Figure 2 below shows the proportion of low, medium, and high RTT video calls per country. The majority of video calls for North American and European countries have low RTTs. Specifically, the United States, Canada, Great Britain, Germany, and Ukraine have low RTTs for more than 75% of video calls on average.
In contrast, video calls in Asia and Australia have significantly higher RTTs. In the Philippines, Australia, Pakistan, and India, less than 40% of video conferences have a low RTT. In Bangladesh, almost all video calls have medium or high RTTs, though there are considerably fewer calls than other countries (see Figure 1).
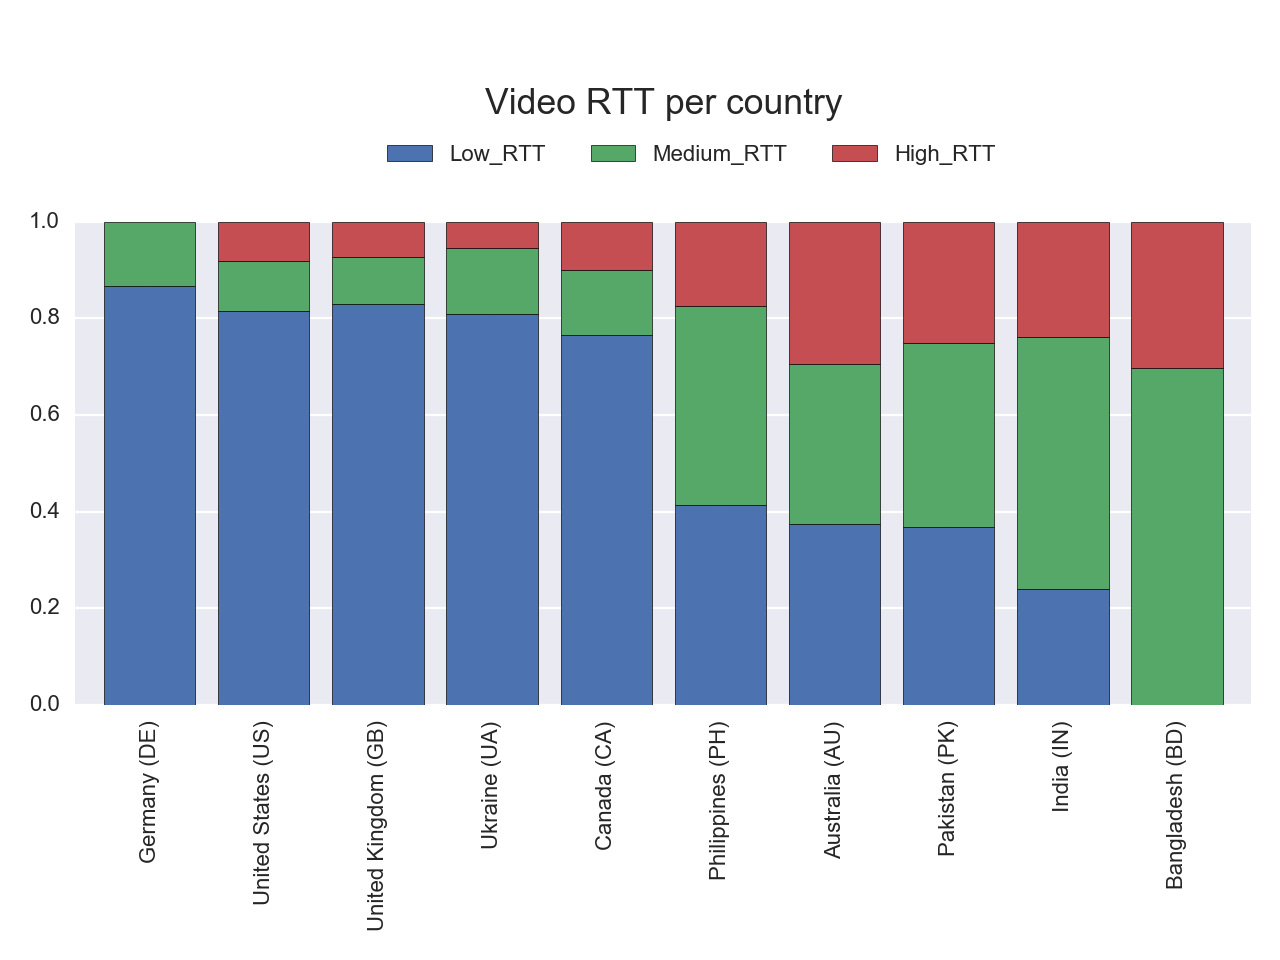
Figure 2: A small sample of a large set of data pertaining to video RTT per country.
This data shows a continental segregation. Continental segregations may occur when traffic is highly localized. Calls between people within a particular country (domestic calls) can result in a low RTT, while calls across geographies (international calls) can result in a higher RTT.
The distance between Helsinki and San Francisco is 8,700 km, based on the speed of light in fibre which is usually about 2*10^8 m/s, the RTT would be ideally about 42,5 x 2 = 85 ms. Of course, networks are not direct lines and there are network devices in between creating extra latency, so more realistically, it takes about 100 ms. This results in an RTT of 200 ms. Dissimilarly, domestic RTT between San Francisco and New York City is about 75 ms.
Figure 3 shows the cumulative distribution for the RTT of four continental areas: North America, Europe, Southeast Asia, and Australia. From this comparison, we can see that countries in North America and Europe have a fairly low RTT (the median is below 100 ms), while other countries have fairly high RTTs (all data is above 200 ms and the median is close to 300 ms).
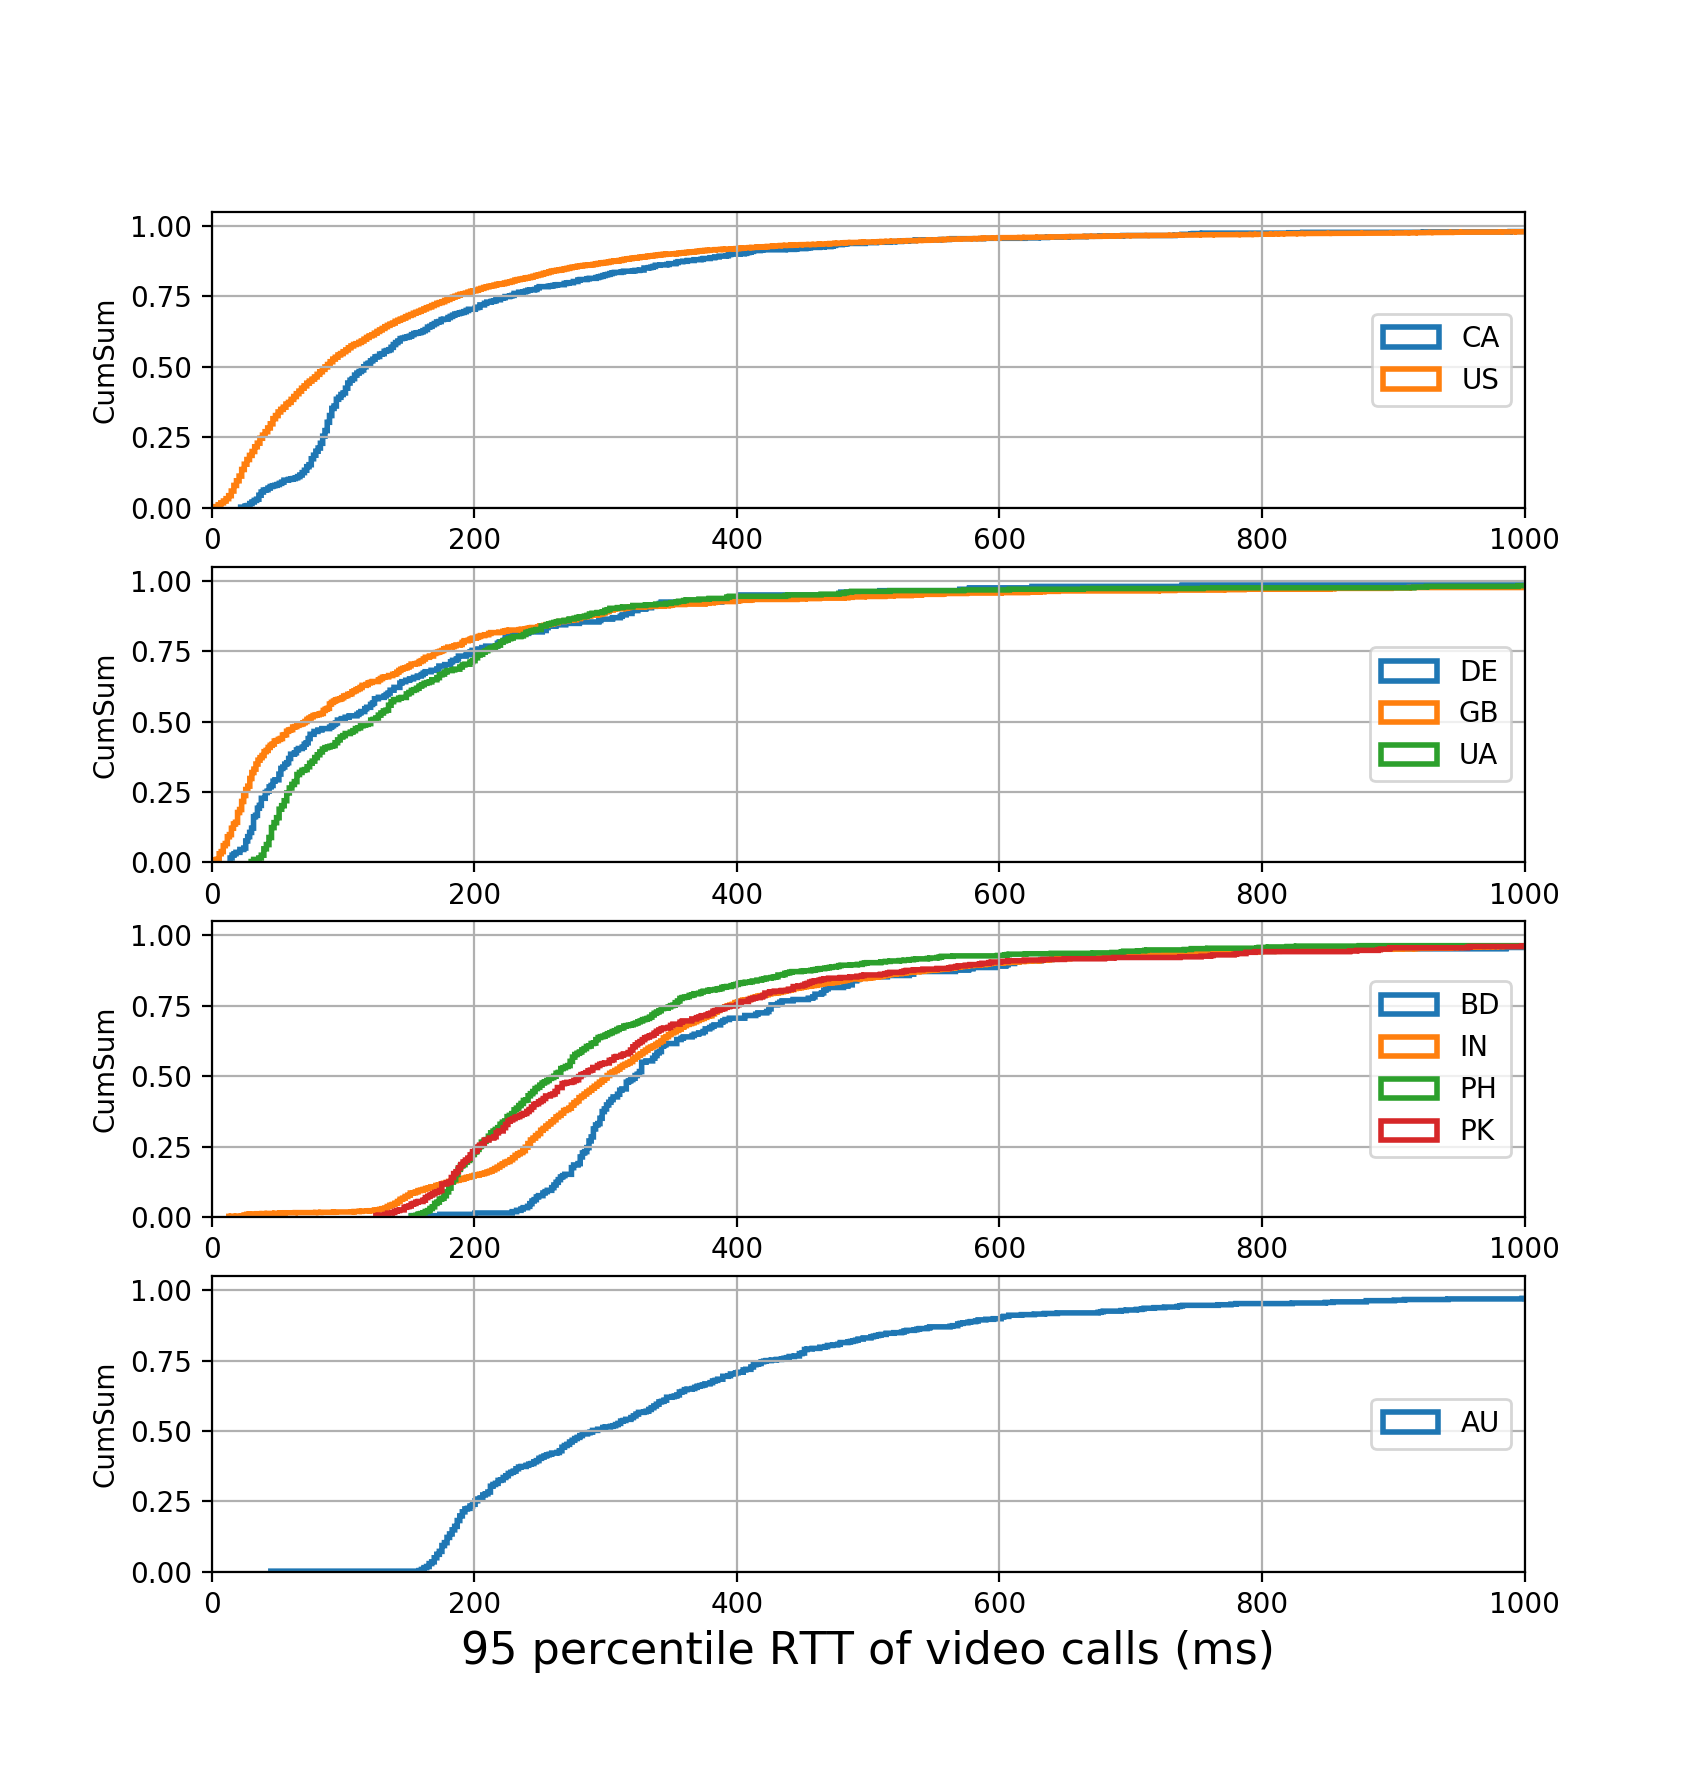
Figure 3: Cumulative distribution function of Video RTT per country separated by continent.
Round-trip Time: Domestic vs. International Participants
For the analysis, our Anomaly Detection System employs the geolocations of the participants in addition to their RTTs. Their geolocations are based on MaxMind’s GeoIP lookup, which gives a coarse-grained location sufficient to compare domestic calls and international calls.
North America RTT Variations
Figure 4 shows the cumulative density (CDF) of RTTs for domestic and international video calls in the United States and Canada.
When comparing RTT for domestic and international calls from the United States, the average RTT doubles from 150 ms to about 275 ms, which raises its classification from a low RTT to a medium RTT. This was expected, as the distance between calls should correlate with the RTT.
For Canada, the majority of recorded video calls are international. Similar to the United States, domestic calls in Canada have lower RTTs than international calls. For domestic calls, the average video RTT is about 175 ms, while for international calls, the average is about 275 ms.
Since the United States and Canada are vast countries, some domestic video calls take place over long distances and have RTTs over 150 ms. For both countries, about 80% of the domestic calls have RTTs less than 200 ms.
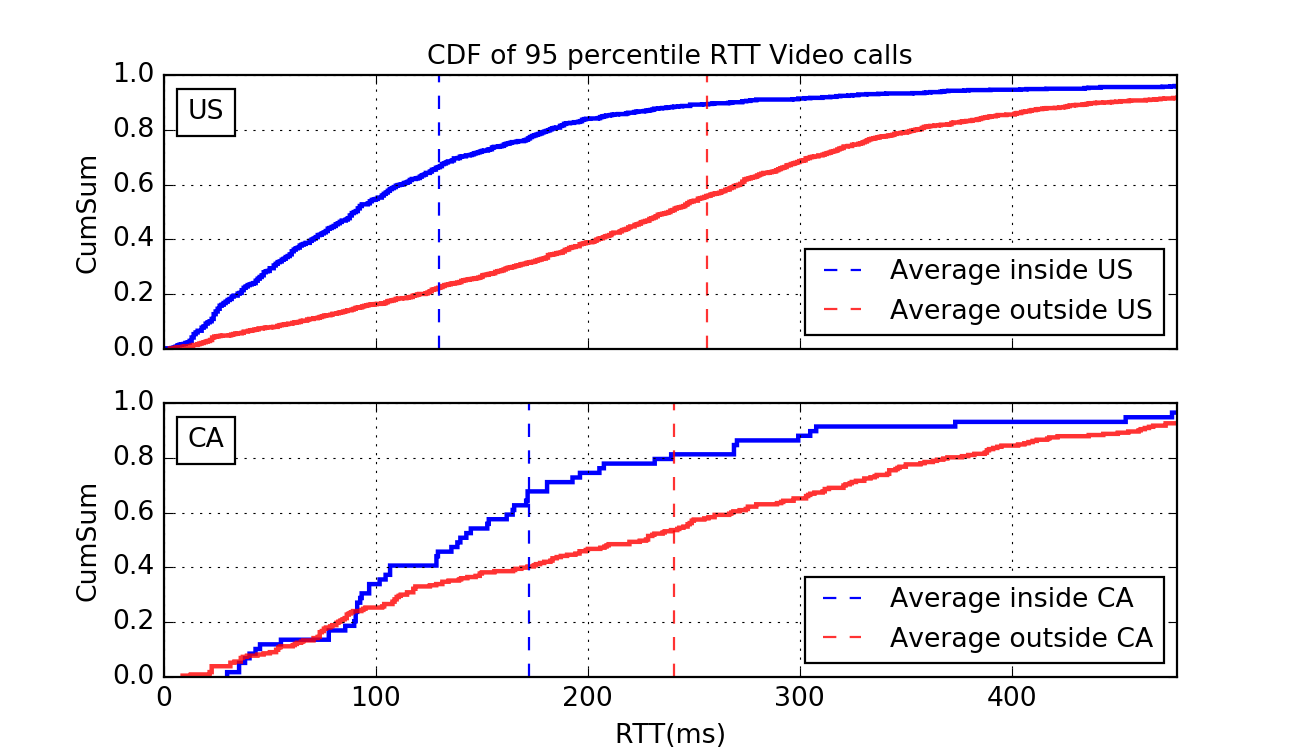
Figure 4: Cumulative density of RTTs for domestic and international video calls in North America.
European RTT Variations
Figure 5 shows the cumulative average RTT distributions for Great Britain, Germany, and Ukraine. Similar to the United States and Canada, Great Britain and Germany have very low RTTs between domestic and international calls. Accordingly, the RTT values correlate positively with distance. About 75% to 80% of domestic calls from Great Britain and Germany have low RTTs of about 100 ms.
The domestic RTTs of Ukraine are higher than that of Great Britain and Germany. In Ukraine, the average domestic RTT is about 200 ms, while in Great Britain and Germany it is 100 ms. Interestingly, the average RTTs for domestic and international video calls in Ukraine are similar, both close to 200 ms.
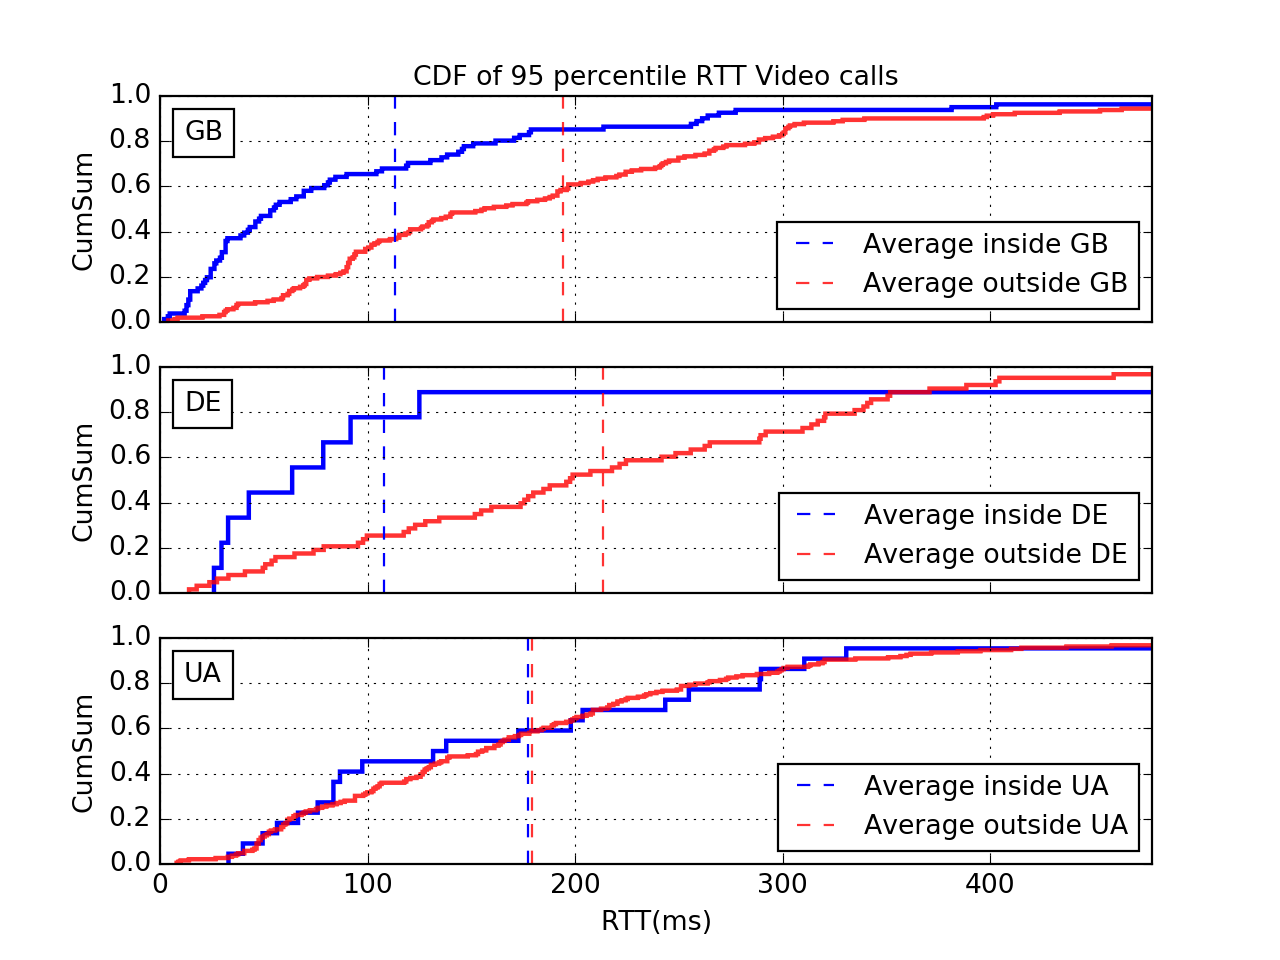
Figure 5: Cumulative density of RTTs for domestic and international video calls in Great Britain, Germany, and Ukraine.
Asia and Oceania RTT Variations
From Figure 3, it is clear that Asia had a considerable number of high RTT video calls. About 25% of those calls were specifically from India. Figure 6 shows the cumulative distribution of RTTs for domestic and international video calls for Australia, India, and Bangladesh. It is important to note that the number of recorded video calls for Australia and Bangladesh are fewer than India or the United States.
Figure 6 illustrates there is a significant increase in the RTTs of both domestic and international video calls for Asia and Australia. The average video RTTs for domestic and international calls is greater than 300 ms, which is considerably larger than the observations in Europe and North America. For Australia and India, about 70% to 80% of the domestic video calls have medium or higher RTTs, and for Bangladesh all the recorded domestic video calls have a medium and high RTT. This shows that domestic and international calls both have high RTT, and do not change due to distance.
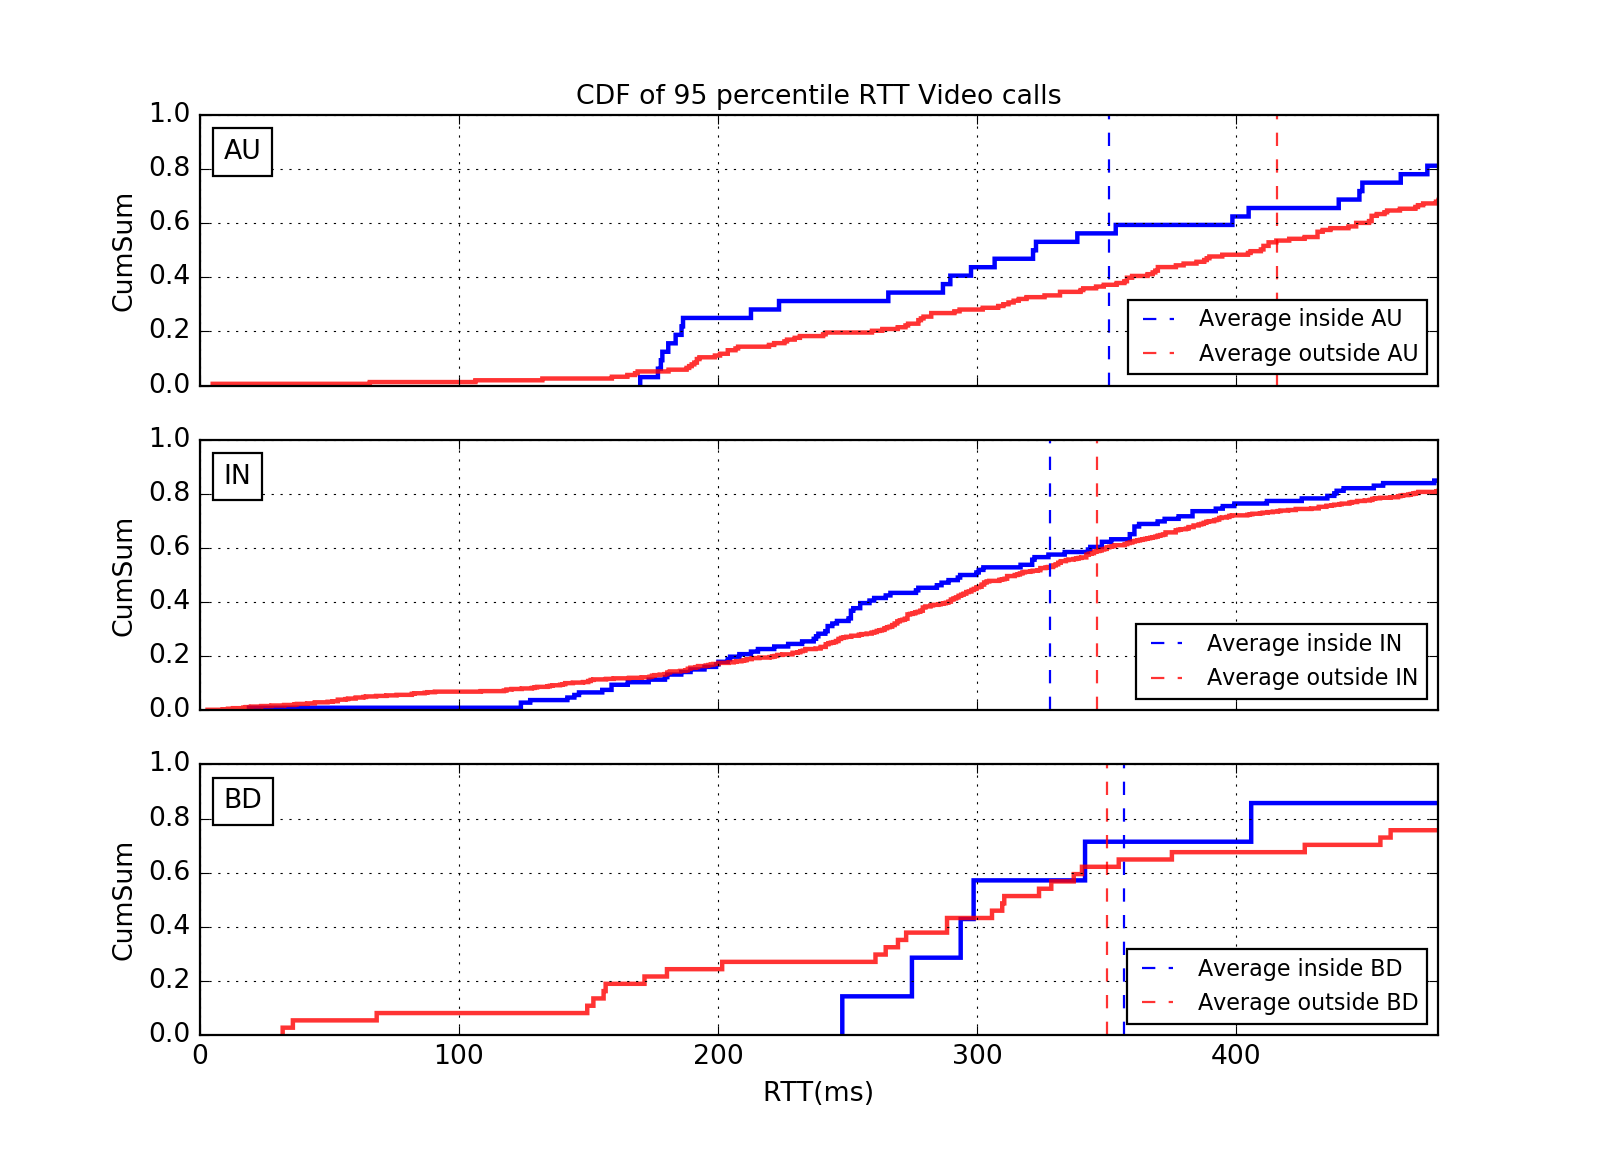
Figure 6: Cumulative density of RTTs for domestic and international video calls in Australia, India, and Bangladesh.
Our Anomaly Detection System observes variation in RTTs to classify dissatisfactory conferences and high RTT values. This data raises the question of why RTTs outside of North America and Europe are so high. Domestic and international calls in Asia and Australia were higher and similar in value to each other, which should not be the case unless the calls are being routed incorrectly.
High RTTs: Hairpinning or Distance?
Normally, RTTs should correlate positively with distance. For example, longer distances between participants of a call should have a higher RTT value compared to participants that are closer, and vice versa. However, our system shows that RTTs are highly correlated with distance for some countries, while for others the distance does not correlate with RTT.
Table 2 shows the correlation coefficients between RTTs and distance for nine countries. A correlation coefficient with a large positive value indicates consistency between variations of the distance and RTT. A correlation coefficient with a large negative value indicates that if one variable increases, the other variable tends to decrease, and vice versa. When the correlation coefficient is close to zero, there is no harmony between variations of RTT and distance.
Table 2: Correlations between RTTs and distance by country.
Germany, Great Britain, Ukraine, the United States, and Canada have positive correlation coefficients between RTTs and distance, while Asian countries and Australia show almost zero correlation. With regards to geolocation, domestic and international video calls in Asia and Australia do not correlate with high RTTs due to large distances between participants. Regardless of where the participants are located, the RTTs are generally high. The phenomenon of sending media data to a far-off location that increases RTT is known as hairpinning. Figure 7 illustrates examples of low and high hairpinning.
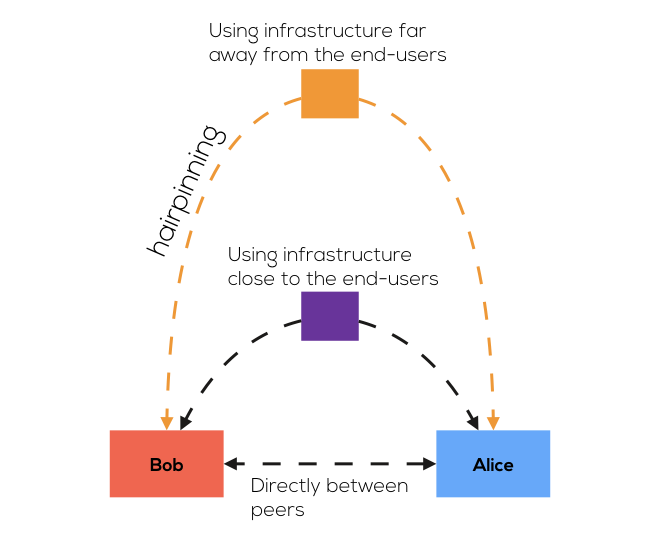
Figure 7: Hairpinning increases RTT with longer network distances.
The main reason video calls in Asian and Australia have such high RTTs is that their media servers are not located in the proper place, i.e., close to the end-users. In Asia and Australia, the infrastructure (e.g., Selective Forward Mixers, the TURN servers, etc) is located further away than their end-users, which causes their RTTs to increase. For this particular service/customer, this accounts to roughly 35% of their traffic. Bringing servers closer to the end-user alleviates these issues. In this particular case, servers in India, Australia, and Brazil will resolve their issues with high RTTs, and most major IaaS providers have offerings in these regions.
That being said, over the next several weeks, we will be releasing our Anomaly Detection System, which will recommend appropriate server locations for our customers. If you are interested in early-beta access, please email us at product[at]callstats.io!


