Figure 1: Our new update to the service level dashboard lets you filter, slice, and dice your data quicker.
What is slice and dice? ⚙️🔧
We are excited to announce Slice and Dice! This new feature enables teams to apply filters on the service metrics to diagnose the issues quicker. Once the filters are applied, you can select the conference details tab to analyze the individual conferences.
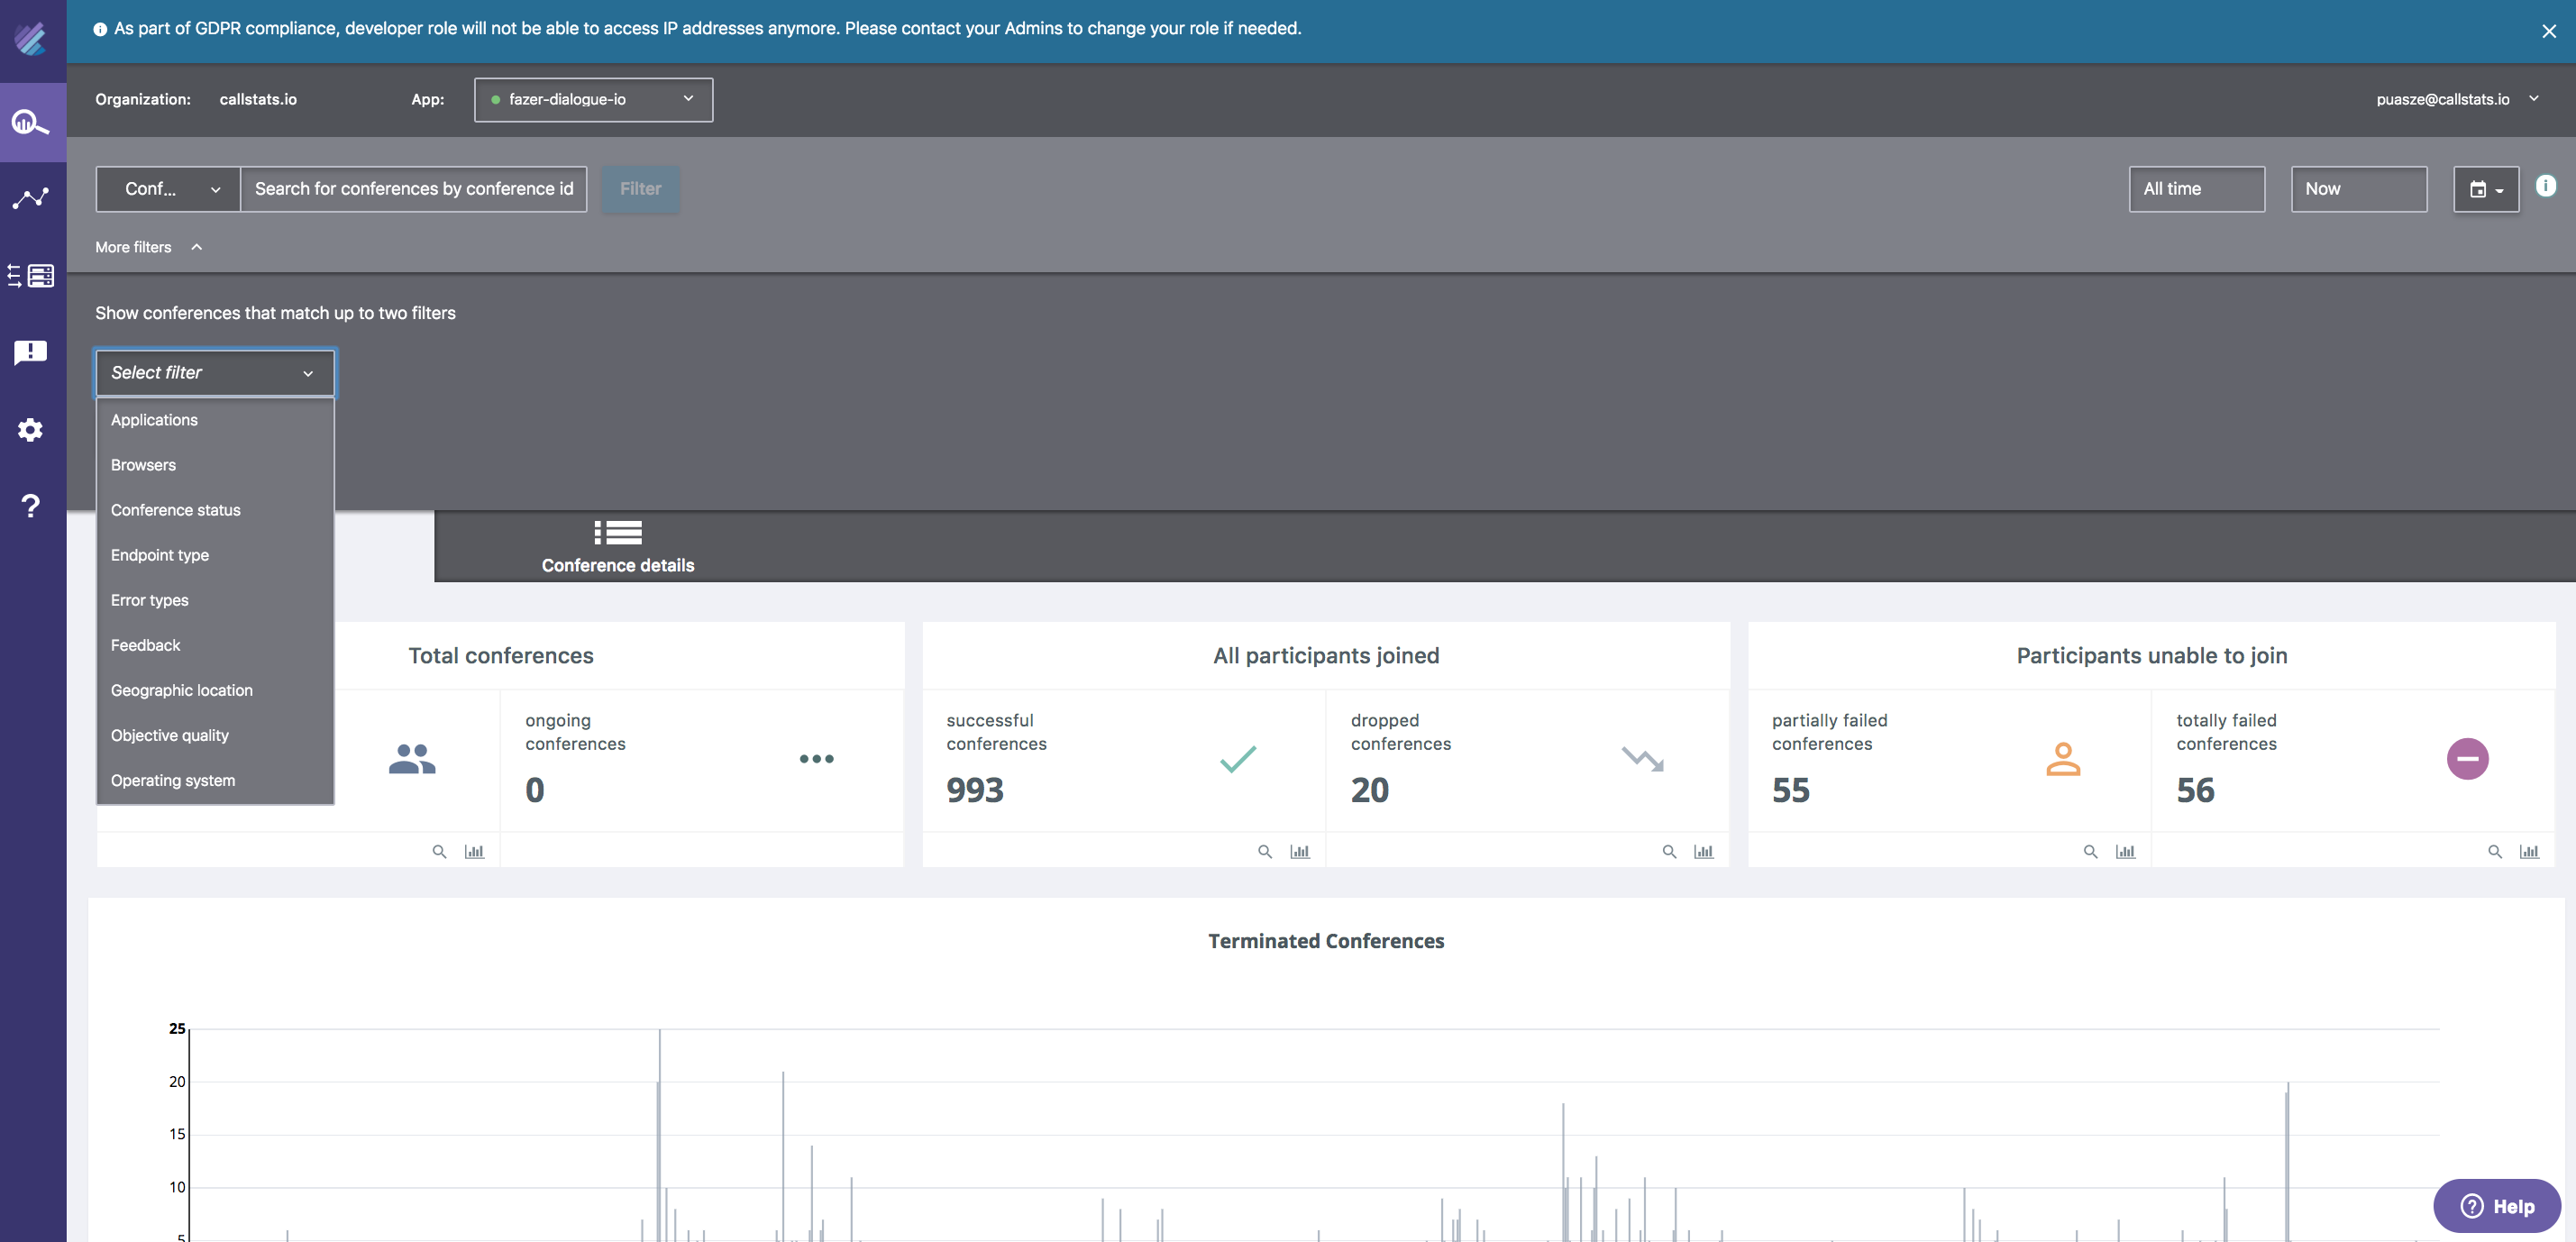
Figure 2: New Filters In Action
We currently support nine different filters with more to come in the near future, including:
- Objective Quality (Excellent, Fair, Poor)
- User Feedback (Excellent, Acceptable, Dissatisfactory)
- Geolocations (Continents and Countries)
- Endpoint Types (Bridge or P2P)
- Browsers and Versions (e.g. Firefox, Chrome, Edge, etc.)
- OS Names and Versions (e.g. Mac, Windows, Linux, Android, iOS, etc)
- Application Versions
- Conference Status (successful, partially failed, totally failed)
- Error Types
We are in the process of adding more filters. To stay updated, subscribe to our monthly newsletter.
Use cases of “Slice and Dice”
Example 1
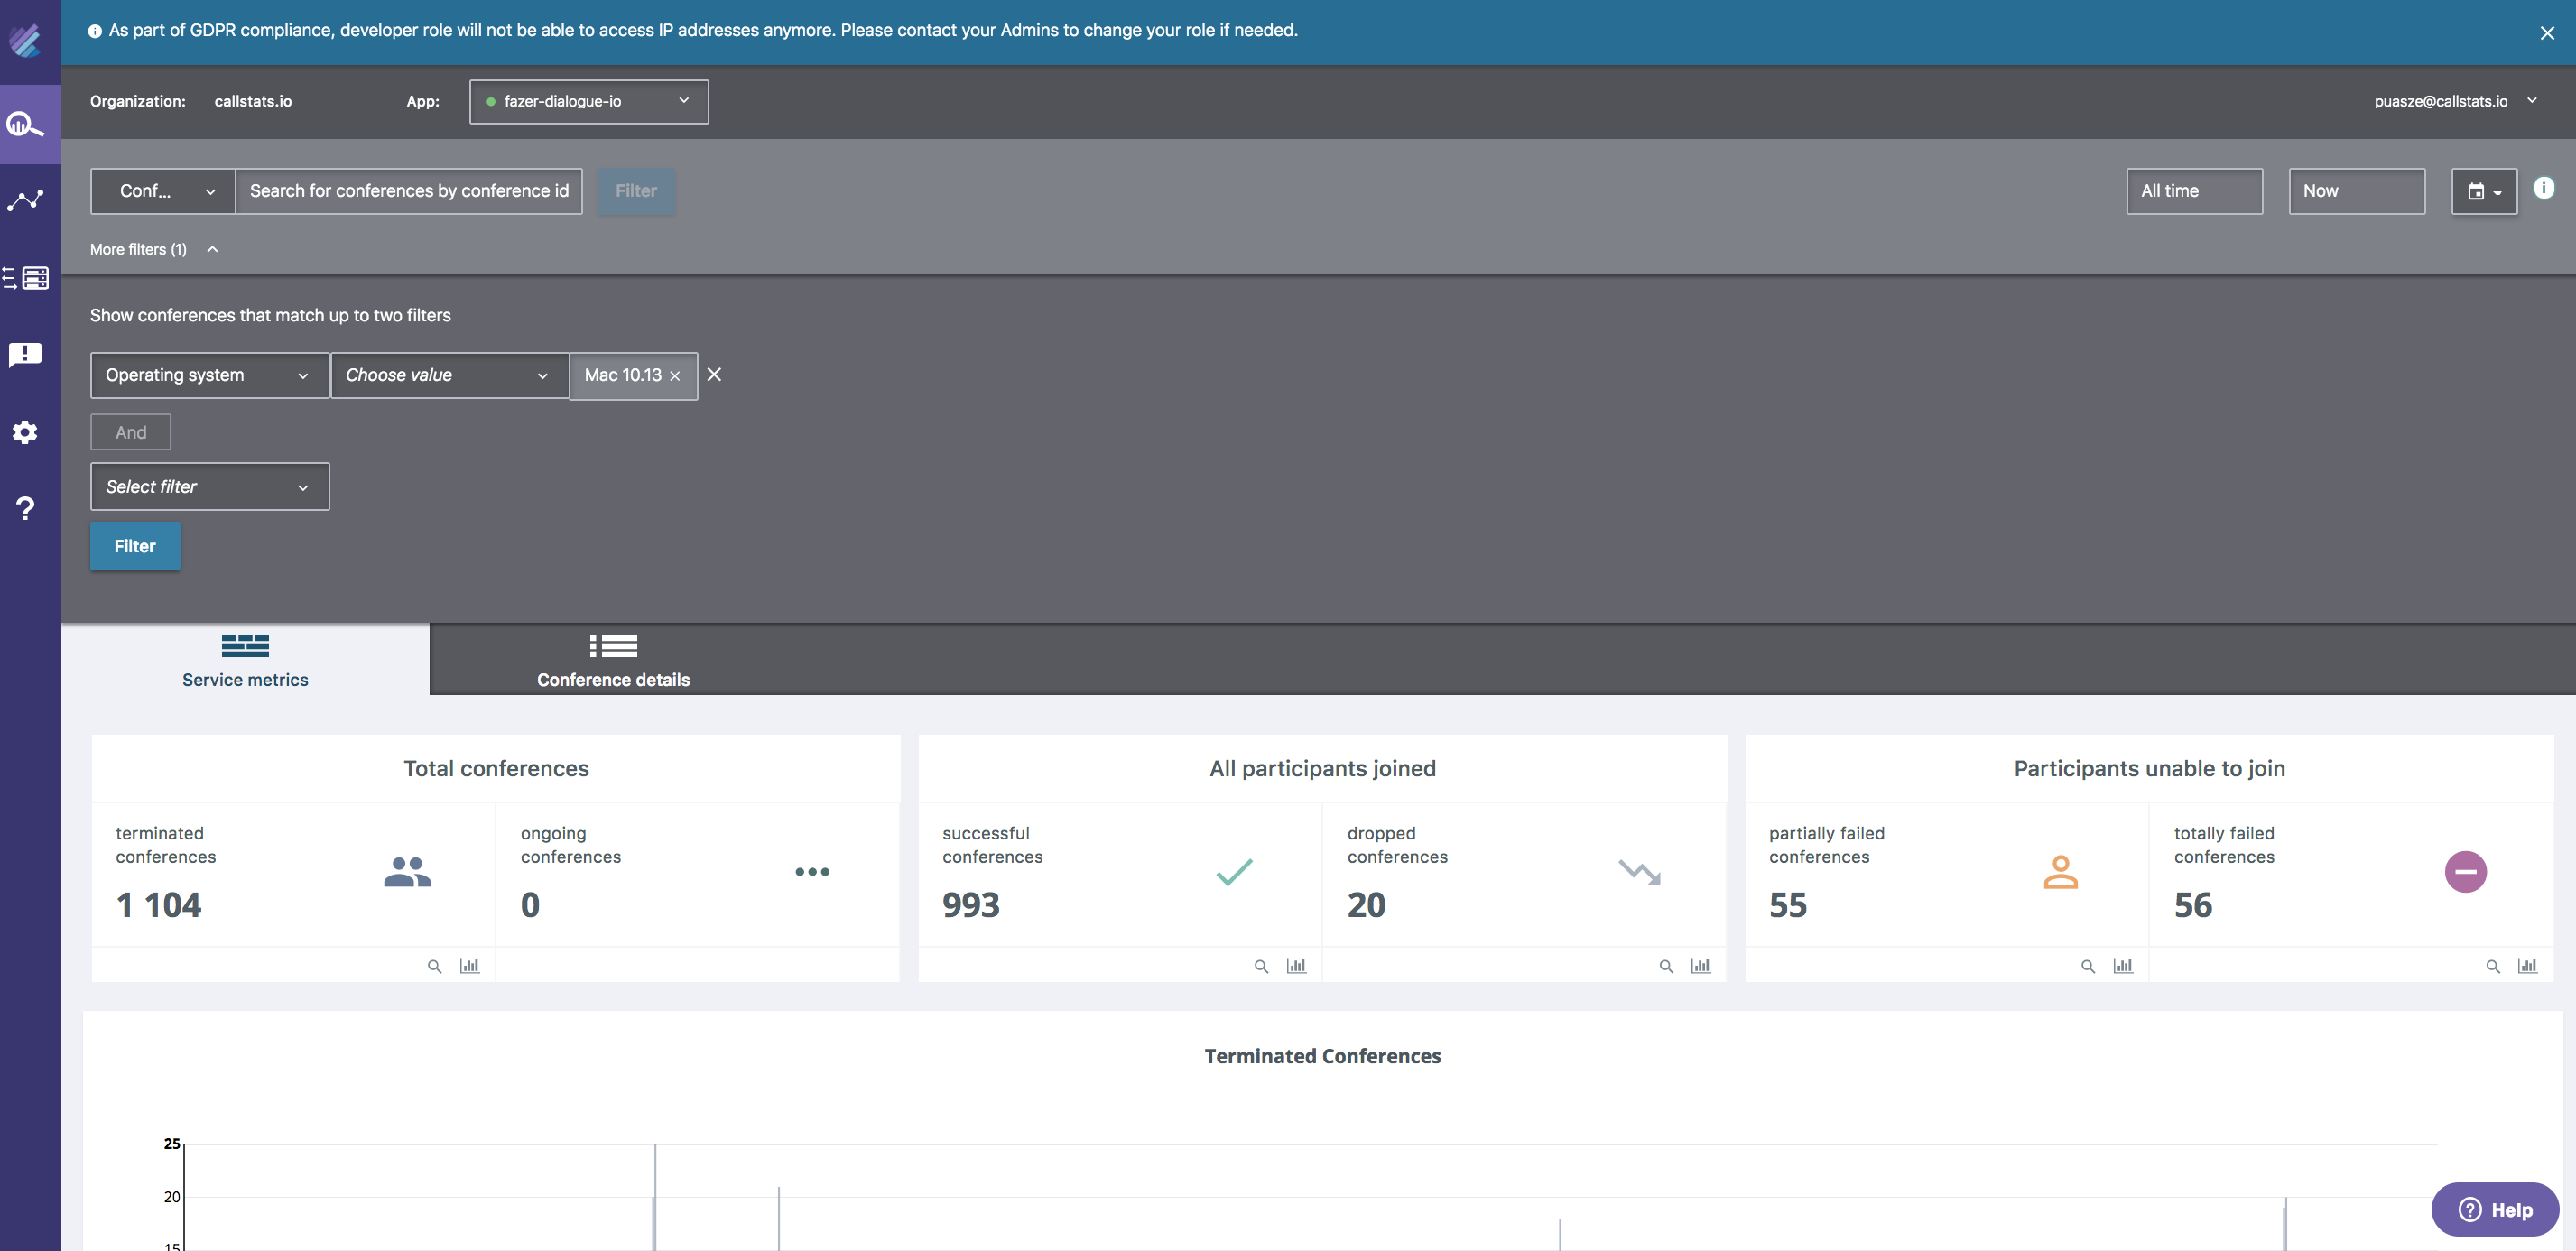
Figure 3: Applying Mac 10.13 OS filter
An end user with a certain Operating System version (i.e. Mac 10.13) is complaining about call failures. As a service provider you might not have access to Mac 10.13 to verify the issue immediately. You can use our “Operating System” filter and find all the conference with Mac 10.13. This would allow you to look at the issues pertaining to that Mac 10.13 and drill deeper into those calls.
Example 2
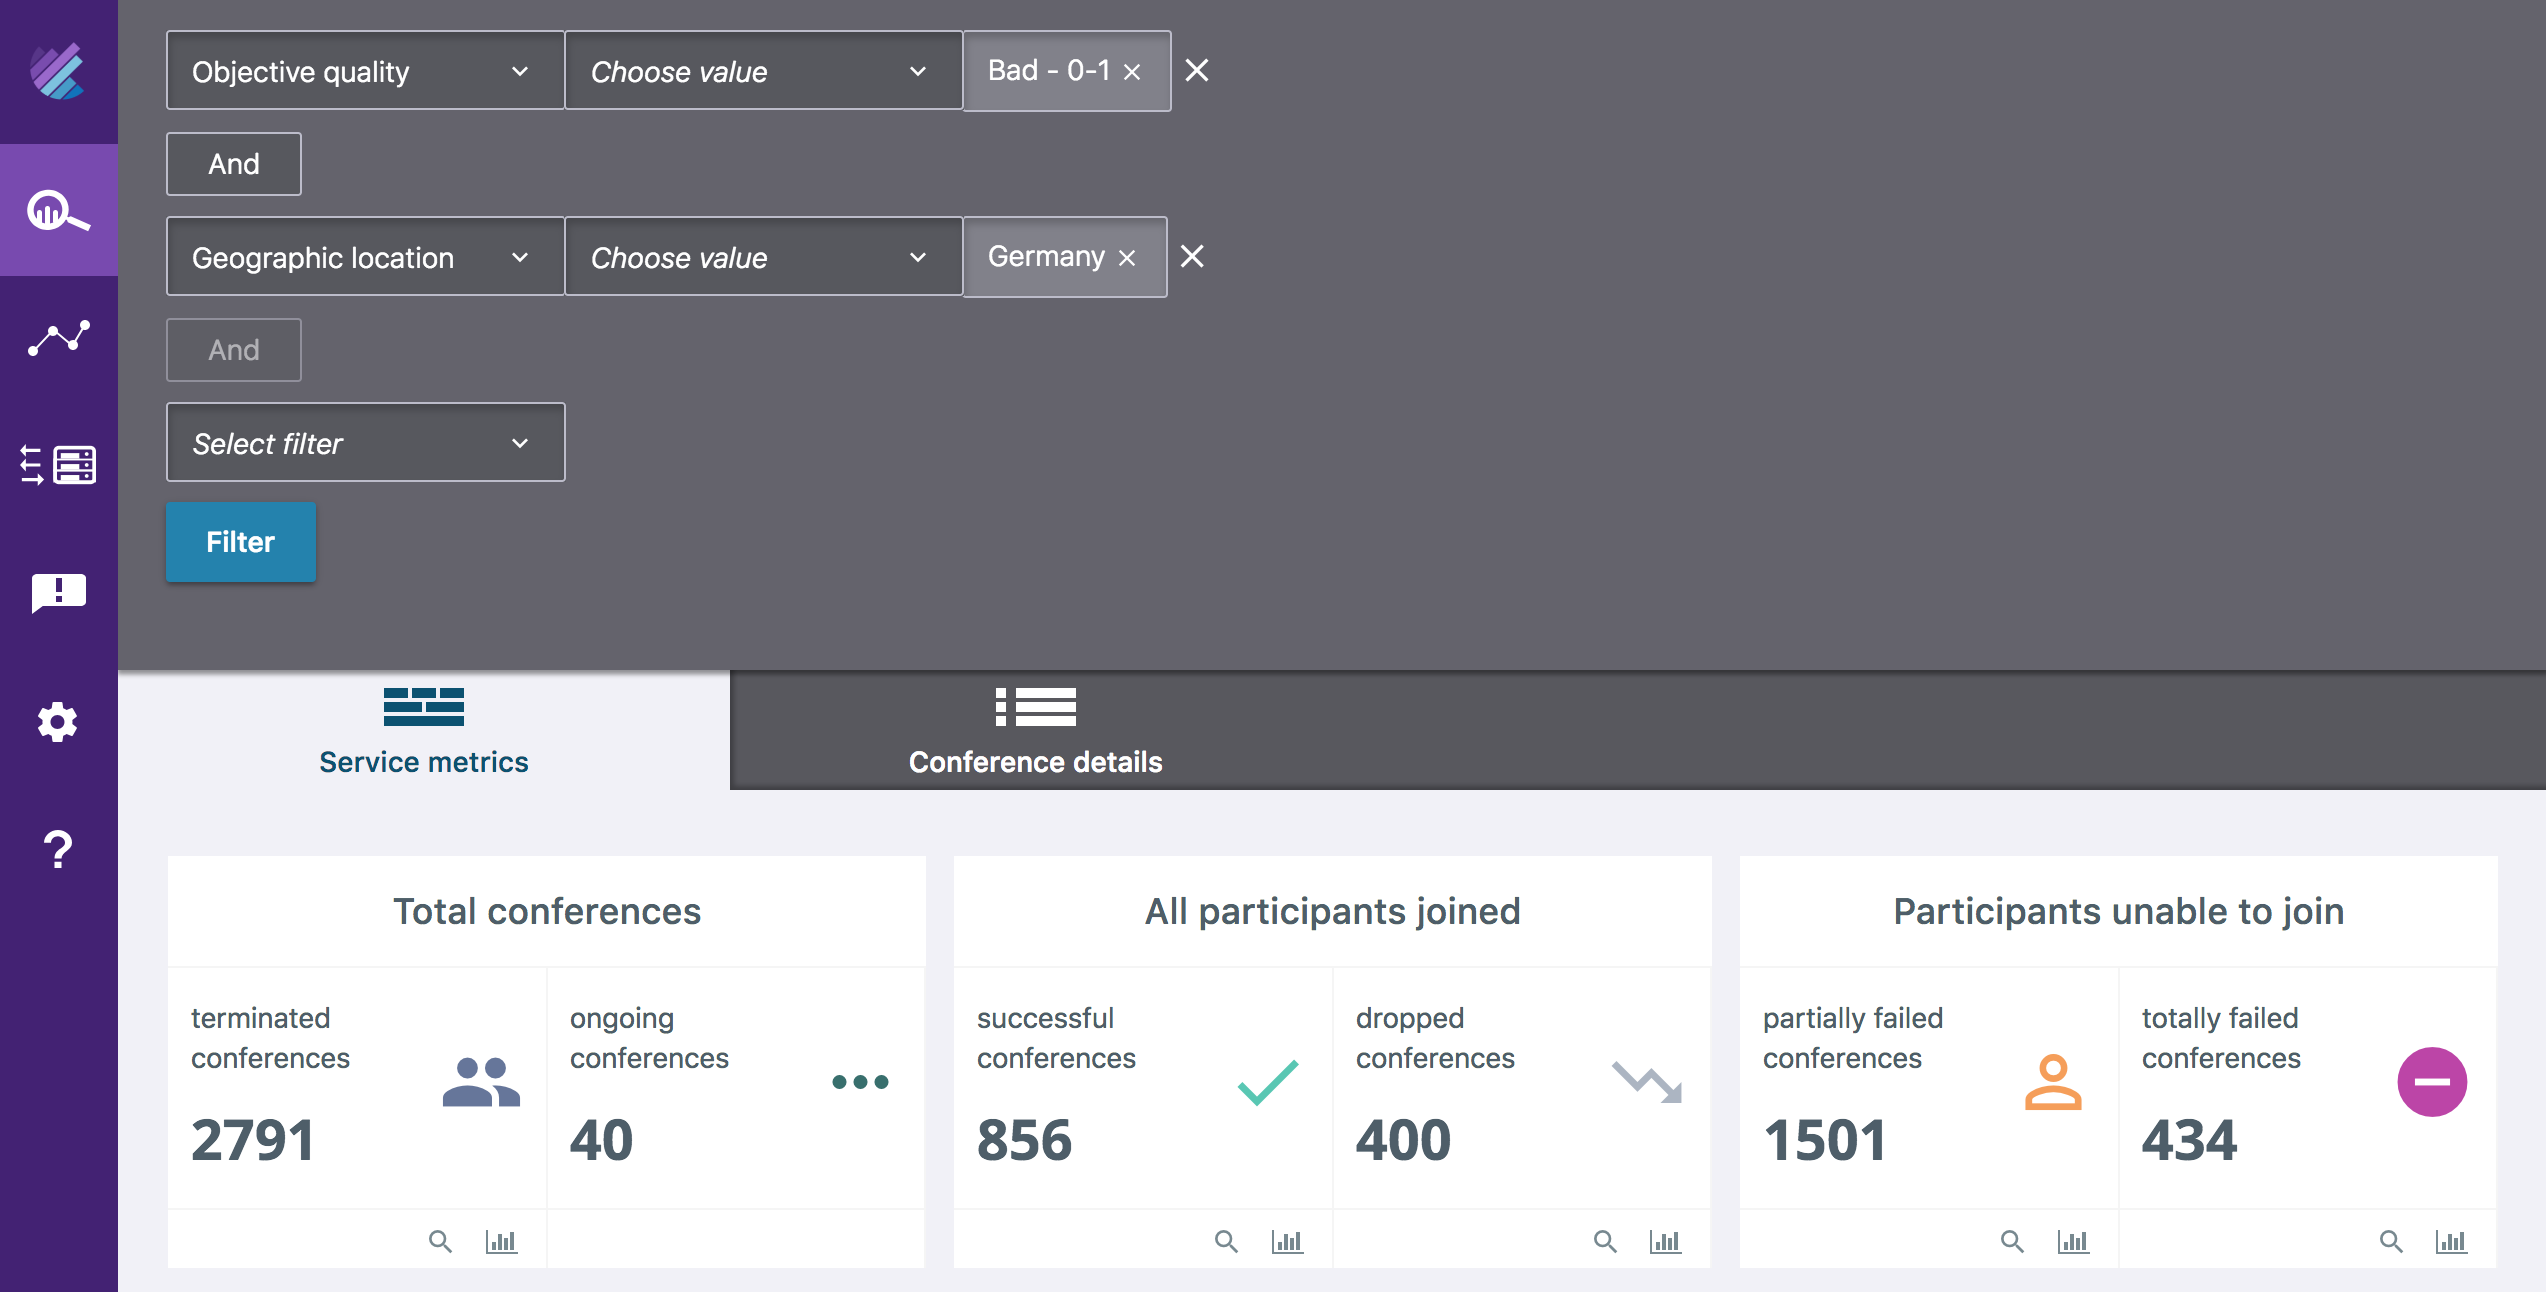
Figure 4: Applying Objective Quality and Geographic Location filters
End users from Germany are complaining about bad QoE but end users from other EU locations are happy with the service. Using the “Geographic location” and “Objective Quality” filters, you can analyze the calls from Germany with low objective quality over the last 2 weeks and single out the issues causing the poor QoE.
Different customer personas can make use of the “Slice and Dice” feature. As a product manager you are able to measure the KPIs such as customer engagement in certain geographic locations, most used application versions, etc. As a developer you are able to segregate the most common factors contributing to the QoE, Issues specific to OS/App/Browser versions, etc. As a customer support person, before escalating a single customer support ticket you can evaluate how many customers are affected by the same issue.
All in all, these filters allow you to save more debugging time and develop a better WebRTC-enabled audio and video product so that you can create better user experiences for your customers.
How to start using Slice and Dice and More Information
If you’re still debating how effective callstats.io will be in your application, check out this blog post.
However, if you’re ready to jump in, experience our hassle-free demo here or sign up for an account here. Currently, this feature is available on all paid plans (Basic, Pro Plus and Enterprise). Filters are limited by plan. For more information, get in touch with our sales team now.
It has never been easier to detect, diagnose, and fix call issues.
Check out some of our past updates for more information about our product.
If you would like to more about how you can use AI for your video and audio calls, you can download our white paper on the findings our Anomaly Detection System uncovered here.
Want to start slicing and dicing your call data? Request a demo here.


