Objective Quality (OQ) is a popular high-order metric displayed on our dashboard. It evaluates the quality of a conference call by giving each stream a score. Today, we are rolling out Objective Quality Version 3 (OQv3). In this blogpost, we describe the updates that were made to callstats.io’s popular quality score.
We evaluate the quality of the call by estimating the user annoyance and, consequently, the user behaviour, which is the central element to the callstats.io OQ score. For example, in video communication, if the audio and video are desynced for more than 200 ms, it is noticeable to the participants, which is an unpleasant experience. Despite this, our data indicates that users typically stay and do not drop out of the call because they are willing to cope with the constant delay between audio and video. While the quality of desynced audio and video is not excellent, it might still be good enough for the user to continue the call. Dissimilarly, if, the audio and video delay constantly fluctuates, the quality should be lower. In many cases, the audio going in and out of sync annoys the user to the point of dropping out and rejoining (churn).
Objective Quality aims to provide a single metric that helps our customers evaluate the quality of their calls. The dashboard was previously showing Objective Quality version 2 (OQv2).
Based on our observations and customers’ feedback, we have been working on a new version of Objective Quality that addresses the following known issues:
- The scale of audio (0.0 to 1.5) and video (0.0 to 3.0) scores are different.
- The total quality score is not in the same scale as outbound/inbound (a.k.a. sent/received) scores alone.
![]()
Figure 1: Sara and Kristen is a popular video used for testing video compression. The quality is lower (around 1.0) for the pixelated parts (left) and higher (around 3.0) for the sharper parts (right).
We addressed these issues, refined the formula, and validated the results for the last month. Today, we proudly announce that Objective Quality version 3 (OQv3) is now available to all of our customers!
Comparison Analysis of OQv2 and OQv3
After rigorous data analysis, the updated OQv3 model captures a more detailed view of inter-dependable metrics. It is further refined for various content types, including content with a lot of motion or an emphasis on capturing details. This addresses screen sharing for presentation slides with a preference for capturing detail and gaming with a preference for capturing motion.
In the following sections, we demonstrate how OQv2 and OQv3 differ, and how OQv3 resolves the issues that came out of using OQv2. We show the comparison of OQv2 and OQv3 with specific care for the general interpretation and improvements.
Normalizing Objective Quality Scores
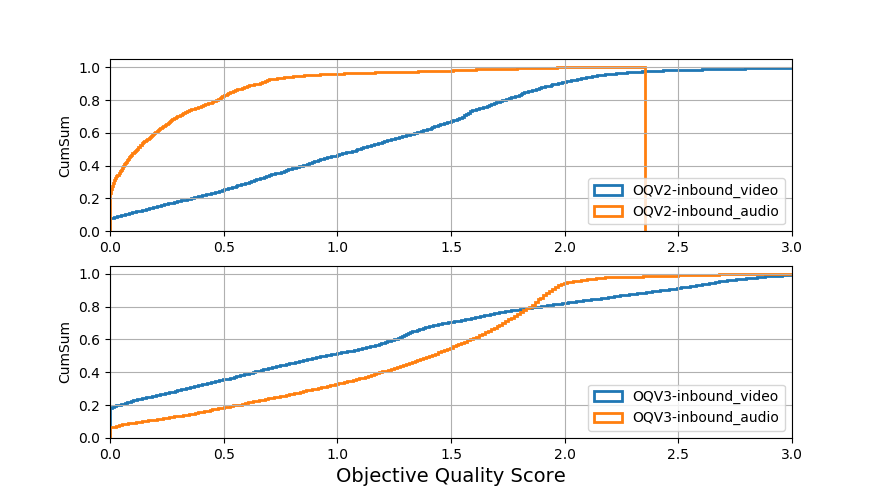
Figure 2: Comparison of OQv2 and OQv3. In OQv2, audio scores range between 0.0-1.5, while video scores range between 0.0-3.0. This has been normalized in OQv3.
Figure 2 shows the cumulative distributions comparing the scores of inbound objective quality of versions 2 and 3. OQv2 scores for audio are significantly lower than video because it was expected that joint video and audio would be the majority and audio-only calls would be the minority. However, there are many situations when the user participates in an audio-only call. In these instances, the aggregated values for OQv2 end up skewing to a lower value depending on the fraction of audio-only calls. Therefore, in OQv3, we decided to normalize the score ranges to result in better aggregate values.
Objective Quality Scores for Inbound, Outbound Streams and Total Average
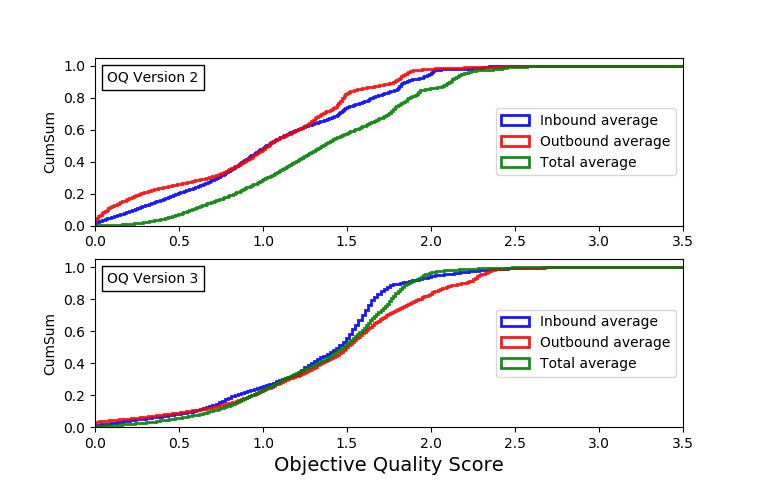
Figure 3: Comparison of Inbound, Outbound and Total Averages for OQv2 and OQv3.
Figure 3 shows the cumulative distributions between the average scores of OQv2 and OQv3. In OQv2, the collected total was higher than the aggregation of the outbound and inbound streams. This has been fixed in OQv3. Figure 3 shows the average scores for OQv3, and in particular that the scores of total are closer to the inbound and outbound scores.
Impact of Frame Size Variation
Objective quality is higher when the frame size does not fluctuate during the call, or when it degrades or improves slowly. The final objective quality score is lower when the frame size fluctuates between resolutions in a short time window. Figures 4 to 7 show different samples of frame size variation and the impact these variations is represented by a number in the range of 0.0 to 1.0. In these cases, 0.0 represents an annoying quality level, while 1.0 is excellent.
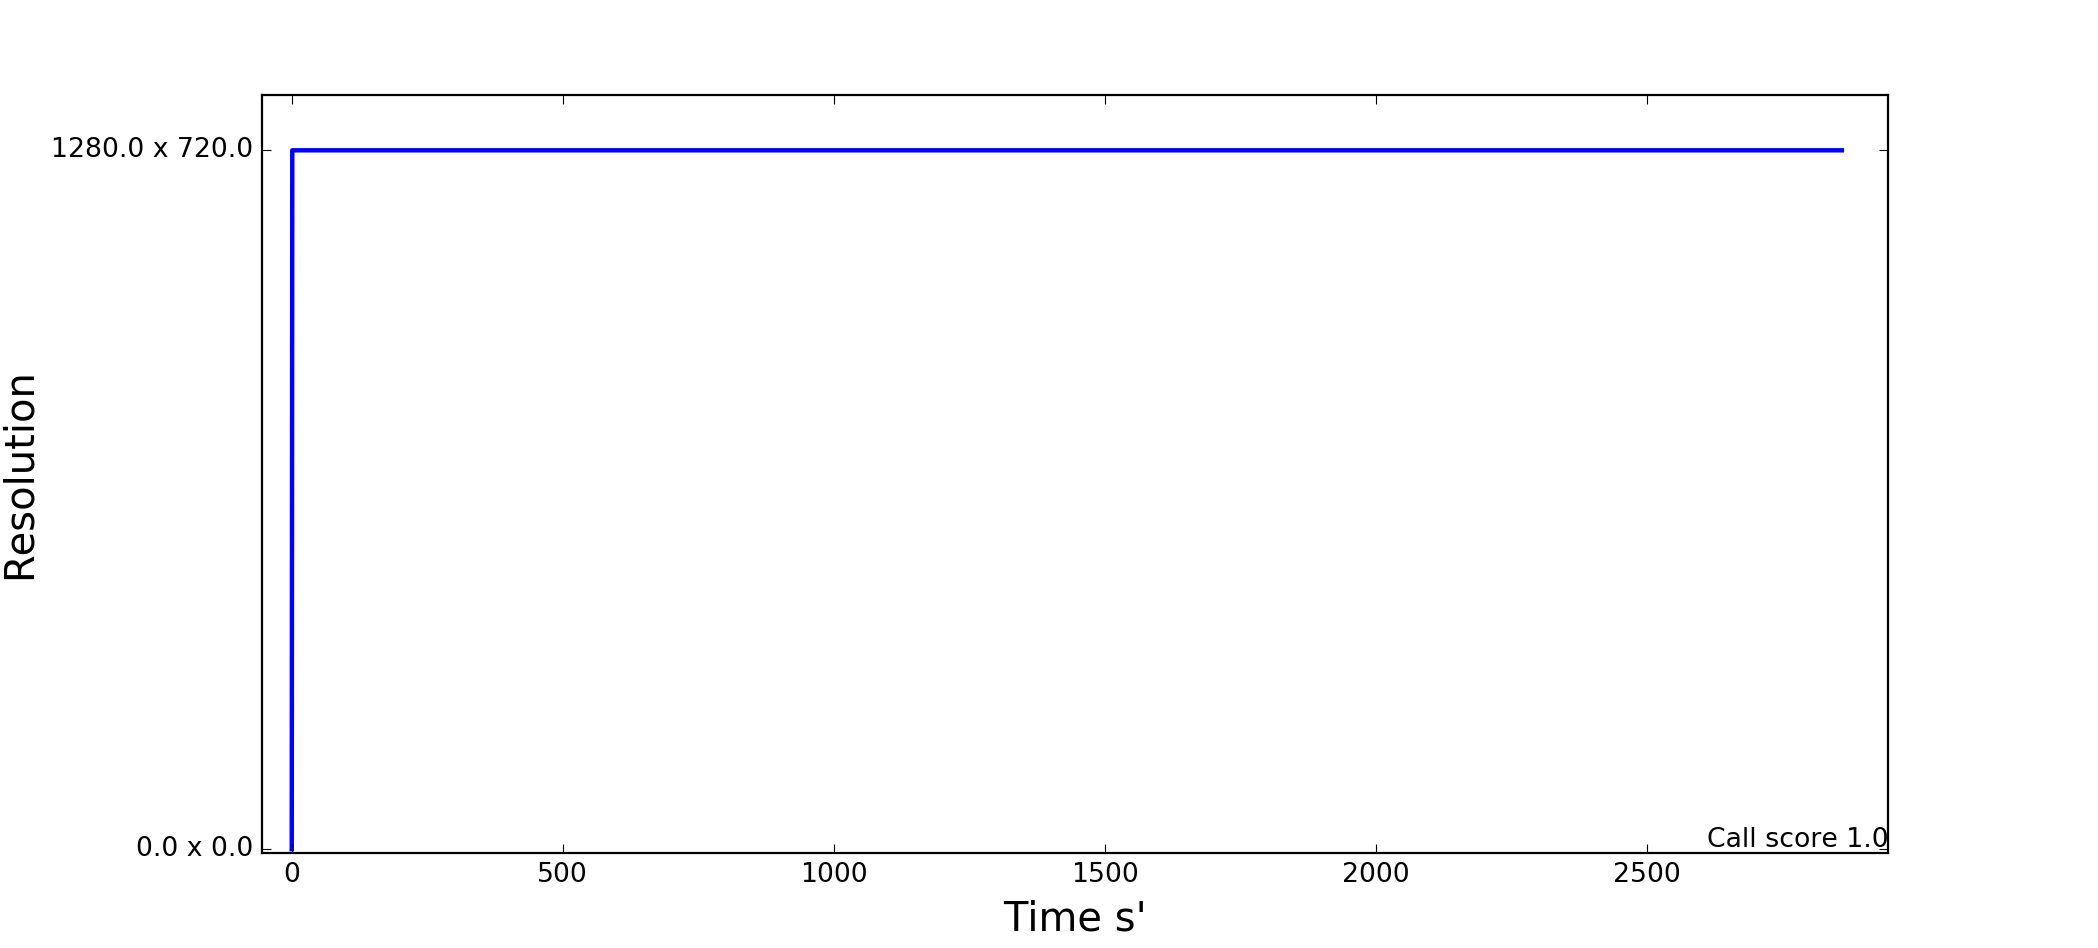
Figure 4: A conference call with a fixed frame size. This is a stable video call with an evaluation score of 1.0.
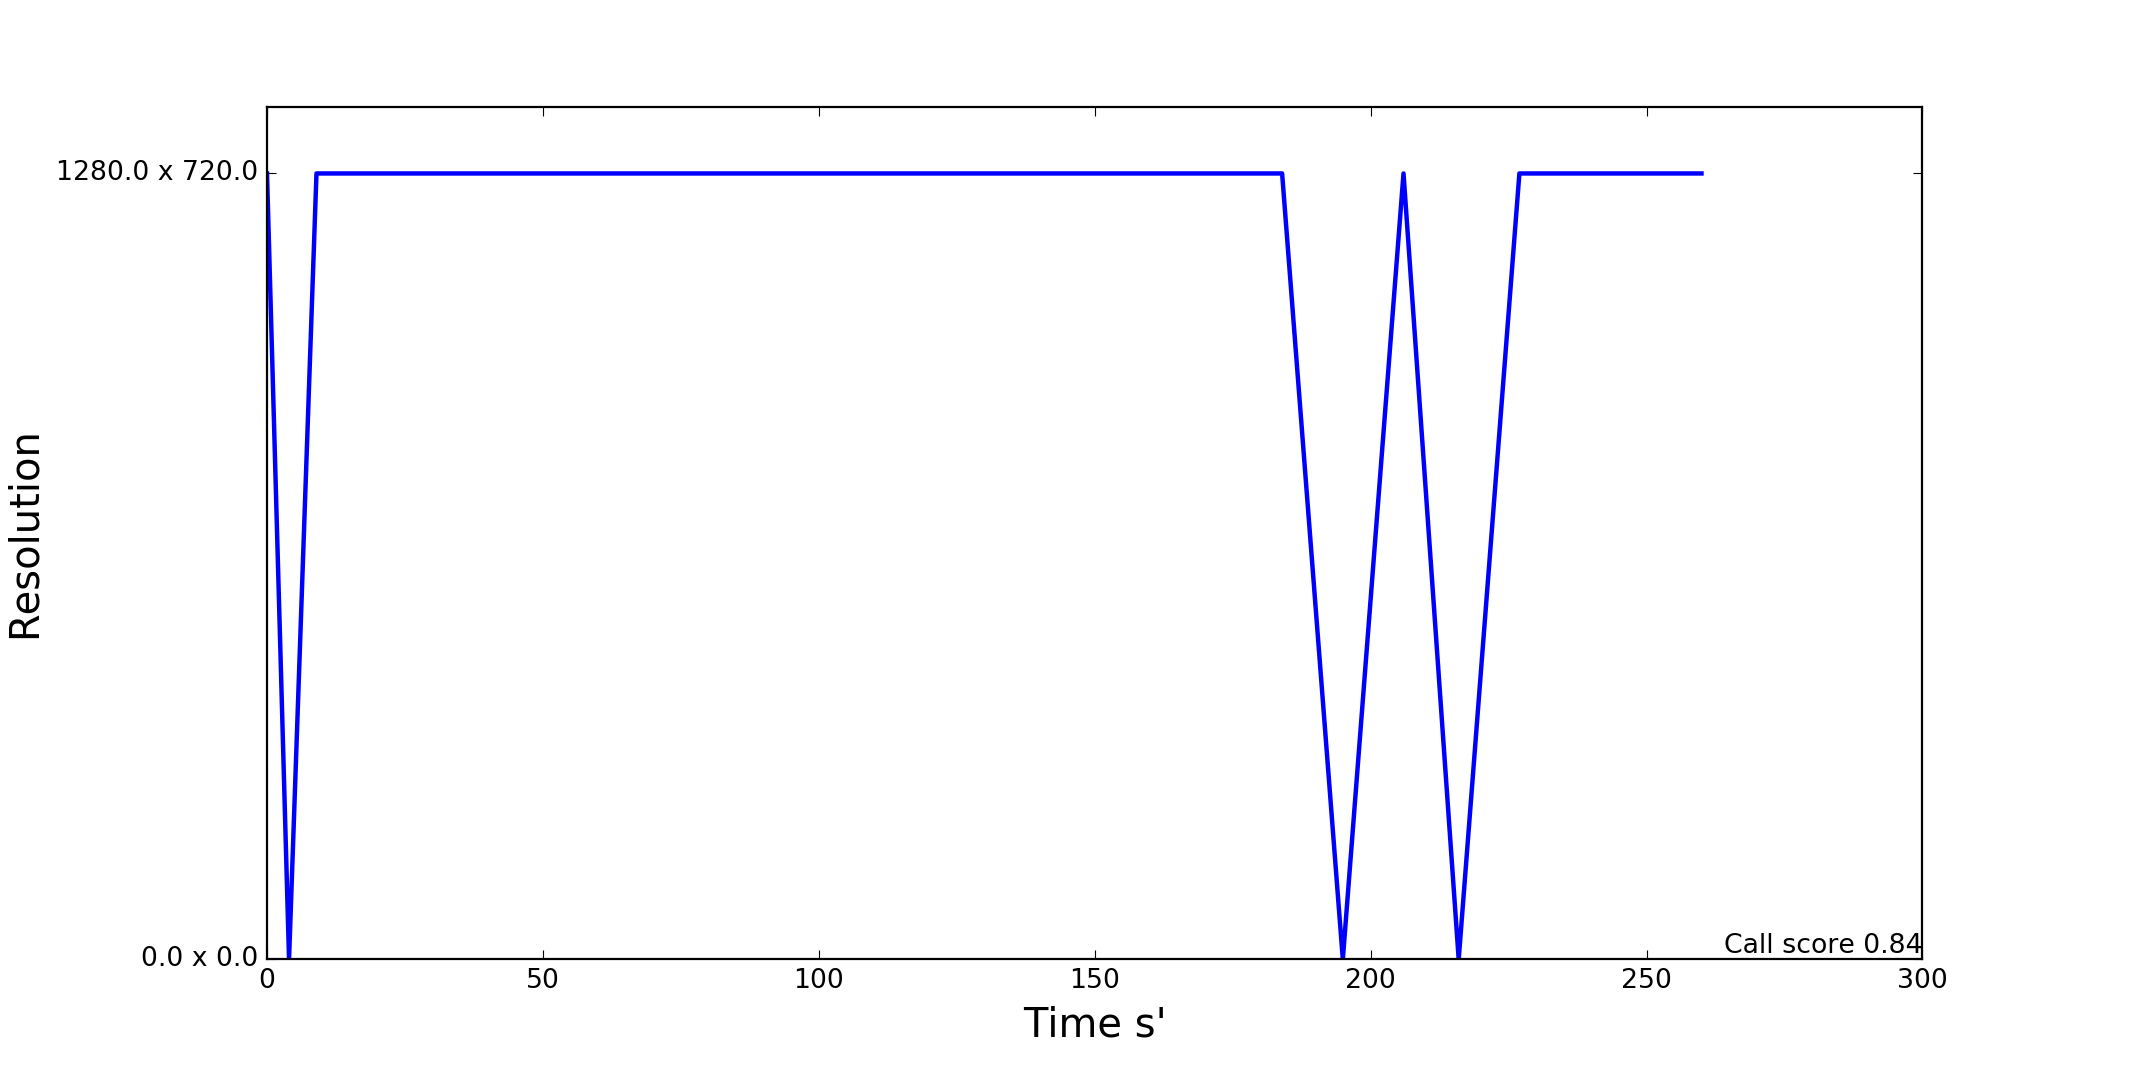
Figure 5: A conference call where the frame size fluctuates for a short time window.
The video call in Figure 5 contains two spikes. Our algorithm considers the duration of the call and the duration of the fluctuations, which led to the frame size variation score of 0.84. For example, a one hour call with ten fluctuations receives a higher stability score than a ten minute call with the same number of fluctuations.
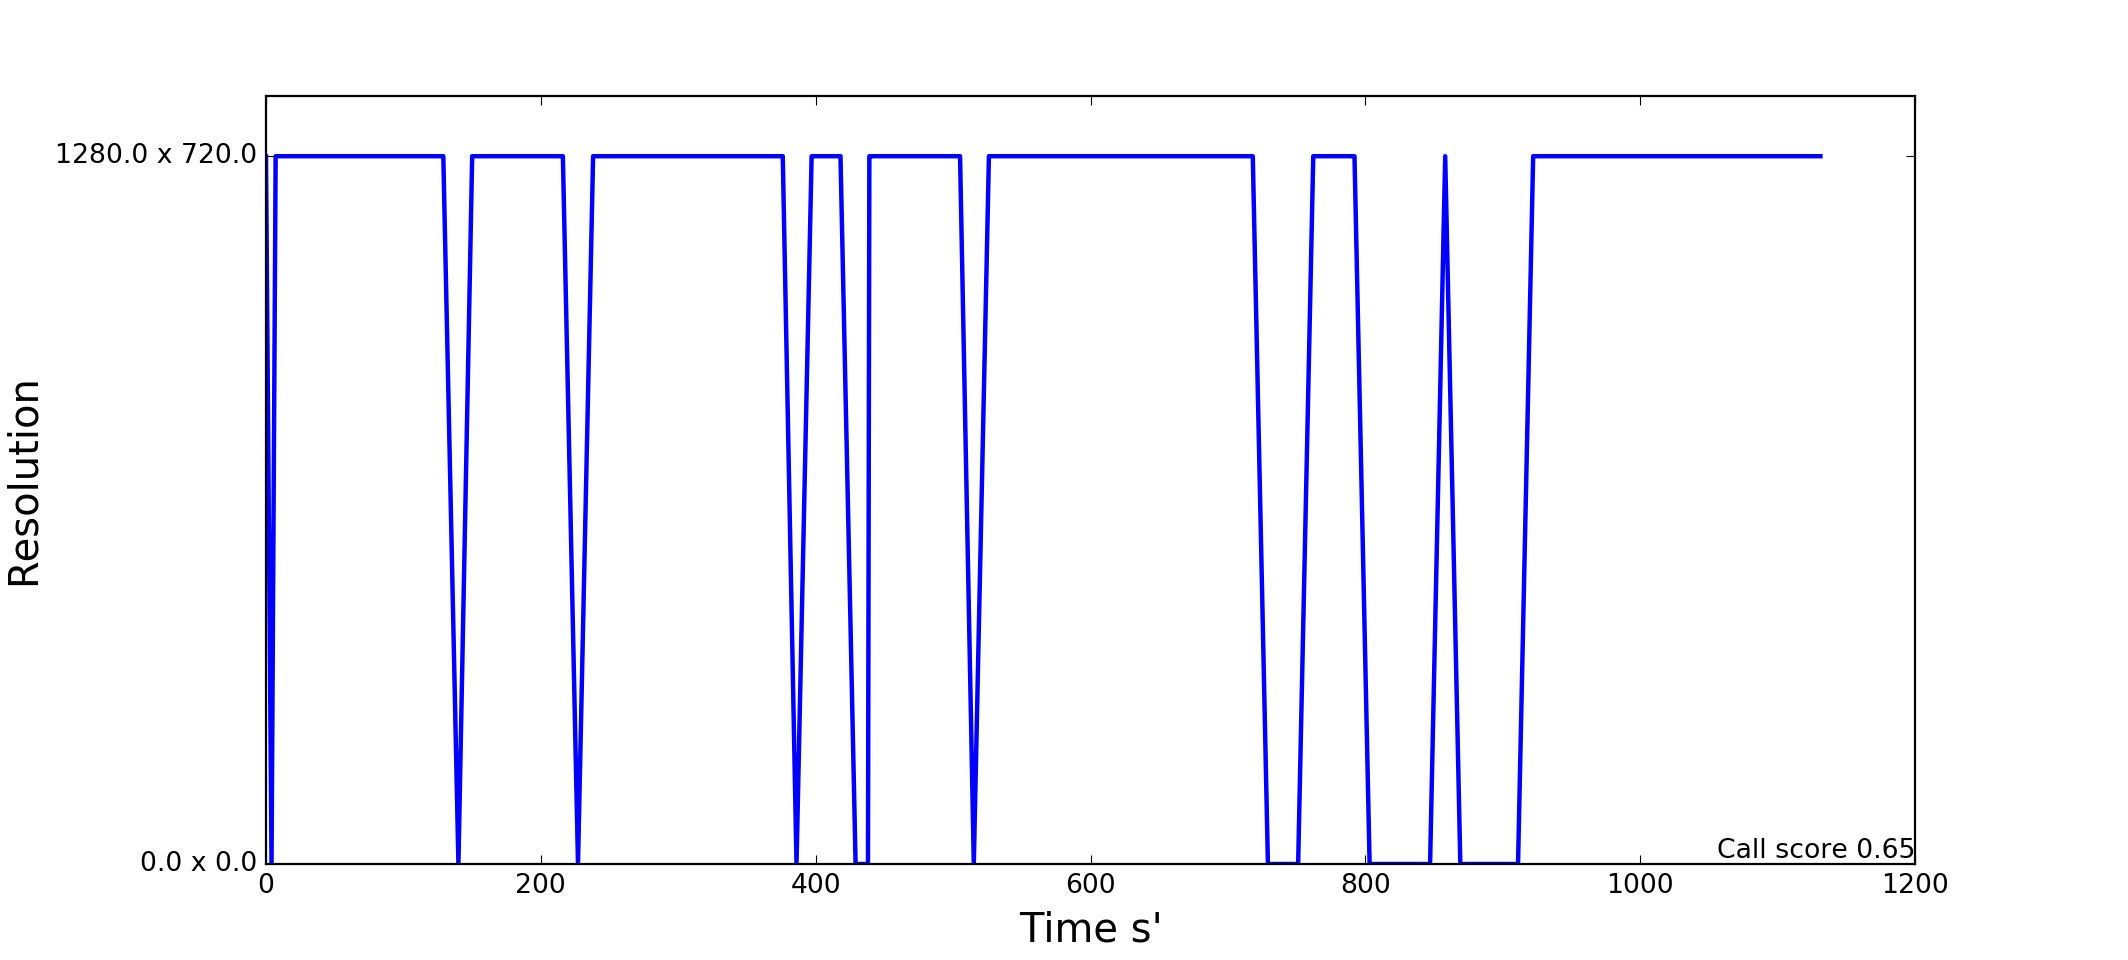
Figure 6: A conference call with several fluctuations.
Figure 6 shows a long video call containing a series of fluctuating spikes between HD resolution and screen freezing. Most of the screen freezings are happening very briefly. The frame size variation score for this stream is 0.65.
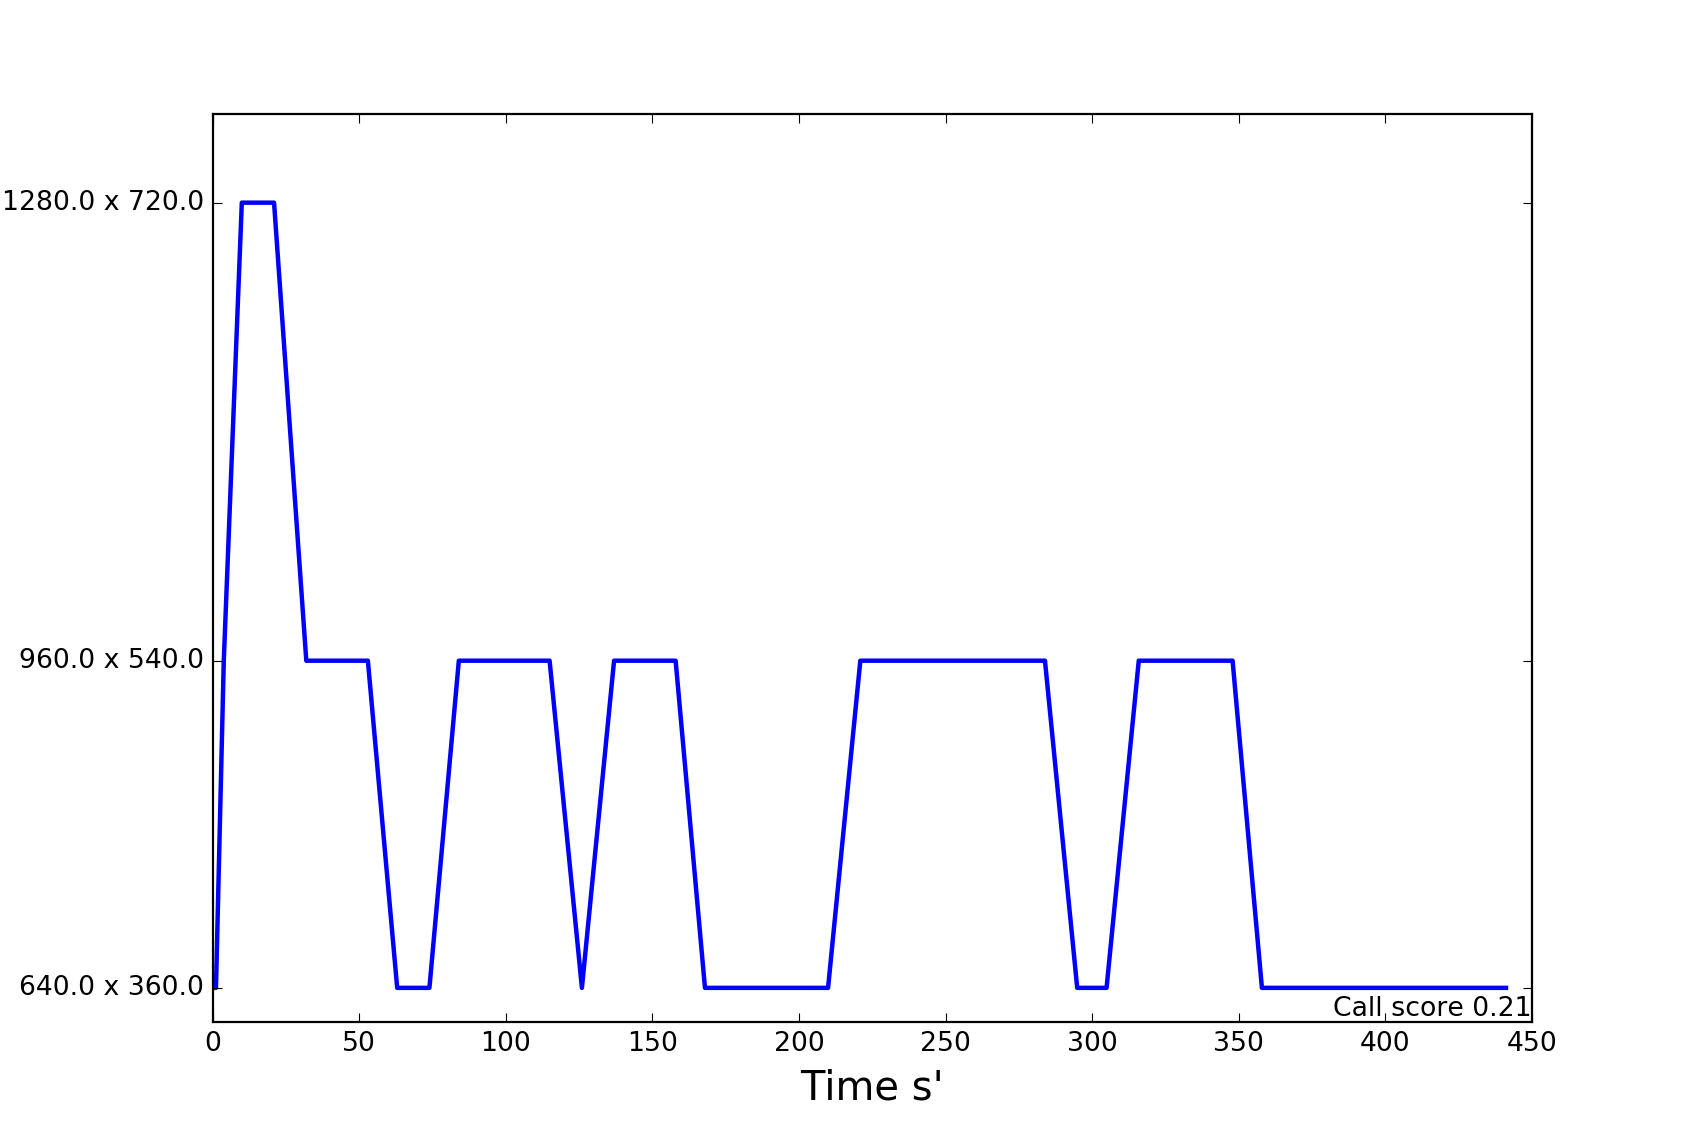
Figure 7: A conference call with several fluctuations.
The video call in Figure 7 contains frame size degradations and fluctuations between HD, qHD and nHD display resolutions . The increased or decreased frame size is appearing in short time windows. Our algorithm considers the frame size fluctuations’ short time window in the quality degradation score. The overall evaluation score of this call for the frame size variation is 0.21.
Conclusion
Today, we are releasing an improvement to our objective quality product. We are upgrading to version 3, which changes several key aspects:
- From now on, scores of objective quality on both audio and video are in the same range.
- The total average of objective quality represents the inbound and outbound streams better.
- The variation of frame size evaluation and its influences on the final score of OQ have been improved.
As always, participants are still able to rate their experience and provide feedback, which can be compared to the objective quality score provided by callstats.io. In the future, we plan to continue our work to make this metric even more reliable for our customers.
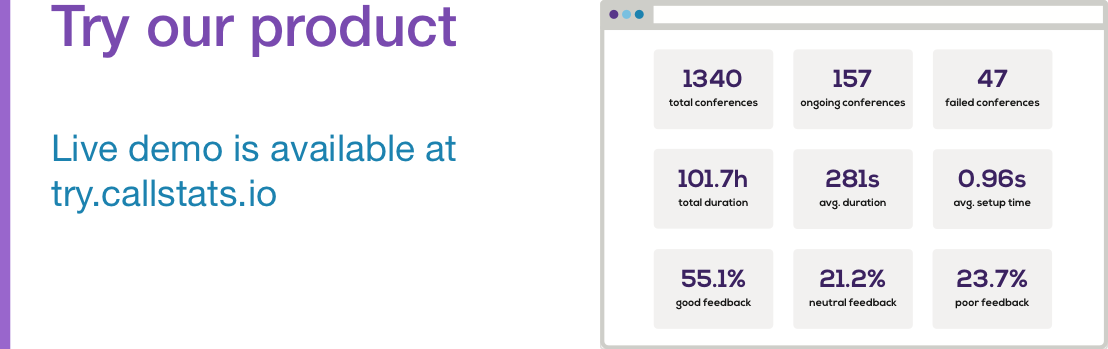
To experiment with Objective Quality, sign up for an account today.