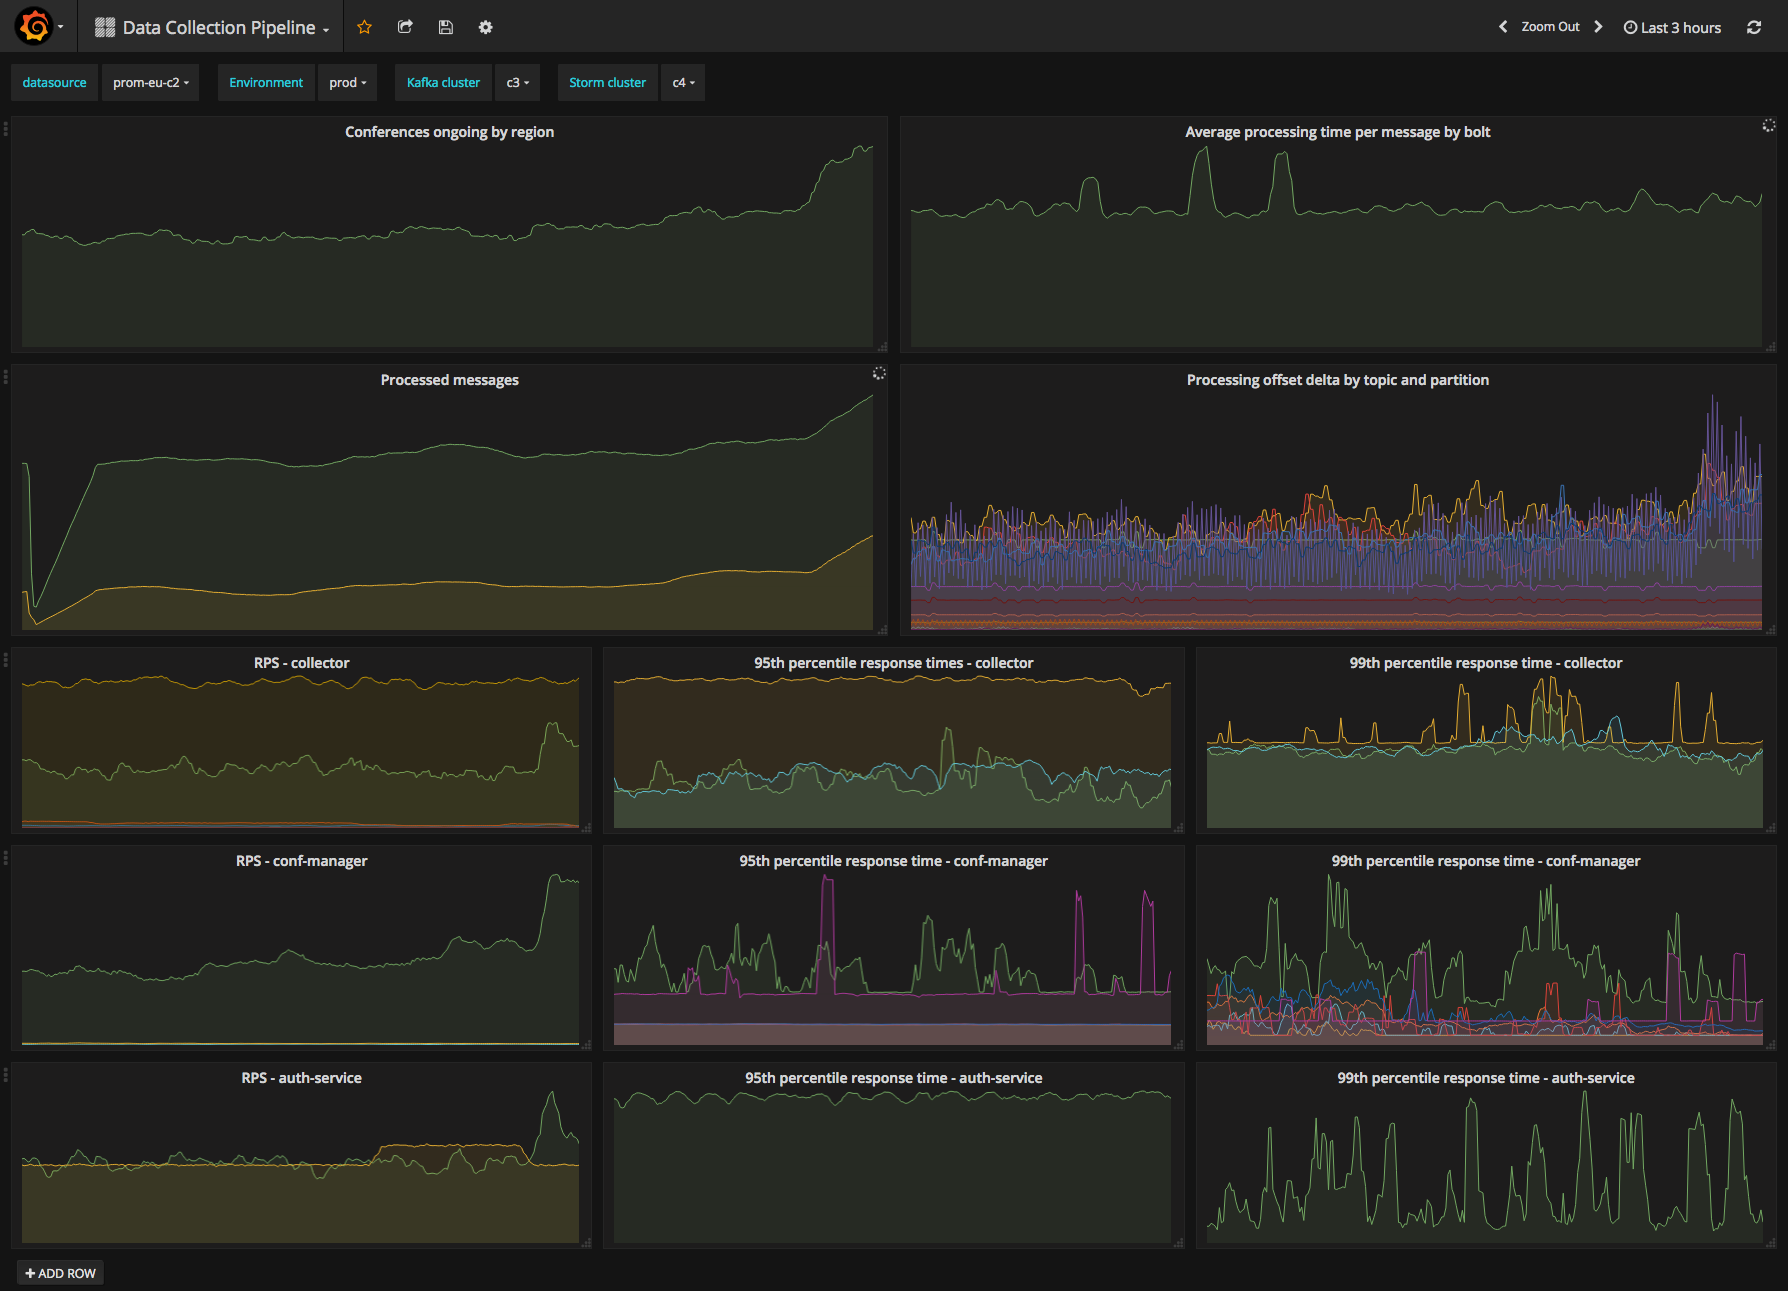
As with most software-as-a-service (SaaS) companies today, the sheer amount of data passed through our systems is huge. Data is flowing through various components, and it is impossible to monitor the status of each component using application logs alone. A proper monitoring system that is used effectively by the engineering team is crucial.
Proper data monitoring, beyond simple logs, is critical for our team for a few reasons:
- We are collecting raw data from various devices and versions of browsers. This data varies significantly and is often outside of our control. This can make it fairly challenging to properly process all the data. To this end, our data collection pipeline must account not only for data persistence, but also for normalisation, aggregation, and many other things.
- We need to understand what components are the bottleneck in our infrastructure so we can manage changes and keep making our system better. Application logs are incredibly useful for debugging application logic, but if we are operating at scale we are more interested in application profiling (e.g., getting distribution of task execution time). Application logs don’t give us this information.
- If our customers experience an issue that causes service performance degradation, we need to be able to detect these issues in an effective way. Application logs do not give us the ability to do that.
Implementing these metrics takes time, but it’s a valuable investment. Inevitably, the system or a customer will experience an issue, and without these metrics, you will be flying blind.
Application Level Metrics with Prometheus
In order to address our data monitoring concerns, we added Prometheus metrics to every single microservice deployed in our infrastructure. Application level metrics are mandatory for any new service before production deployment. They must be implemented for every new feature we develop. For every new service, we ask our engineers:
How are you going to monitor that your feature works and performs at its best in production?
We made this part of our engineering culture. We are, after all, a monitoring company at the end of the day.
Platform Related Metrics with Prometheus
We also use Prometheus to implement platform related metrics, including thread monitoring, process memory, garbage collection, and others. This lets us do application profiling, which helps us understand the root cause of various issues in our infrastructure. For example, a couple of days ago we identified memory leaks caused by incorrect connection closing in one of our microservices We would not be able to detect this incorrect connection closing without proper monitoring of these metrics. We use Prometheus to fine-tune our infrastructure and make sure it is running as efficiently as possible.
We use Prometheus to deal with the massive amount of data our systems must handle every day. But whether you use Prometheus or some other tool, it is vital to have monitoring software to keep track of data and implement metrics. Otherwise, you may wake up some day with a very angry email from your customer and no idea where to start fixing your system.
If you want to improve the quality of audio and video calls in your web application, try a demo of our monitoring and analytics product today.


