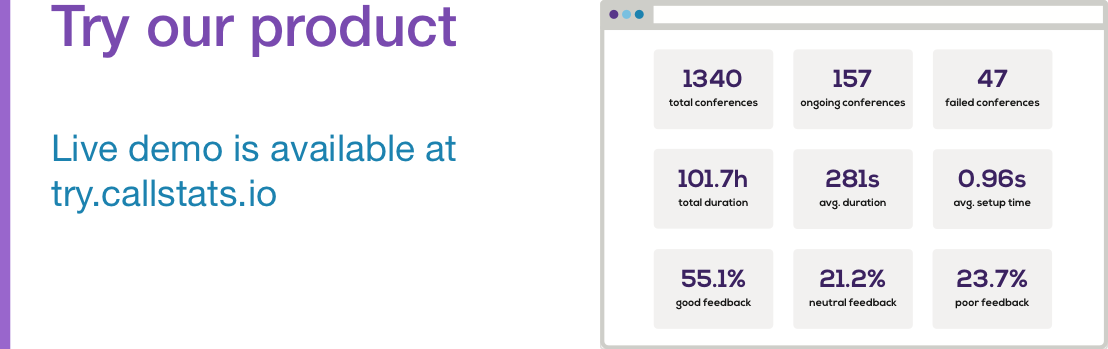
One of the biggest pain points our customers have had when trying to resolve their end user complaints is in gaining a sensible intuition for what is going wrong. Oftentimes, they may only be able to apply the appropriate filters if they have a hypothesis to prove or repeated end user concerns that need to be verified.
We listened to your feedback and are thrilled to announce that Top 5 Metrics is now available on the Pro Plus and Enterprise plans. This new feature can enable teams to collaborate and troubleshoot better by identifying the most prominent app versions, browser versions, locations, and OS versions for app level or a certain criteria.
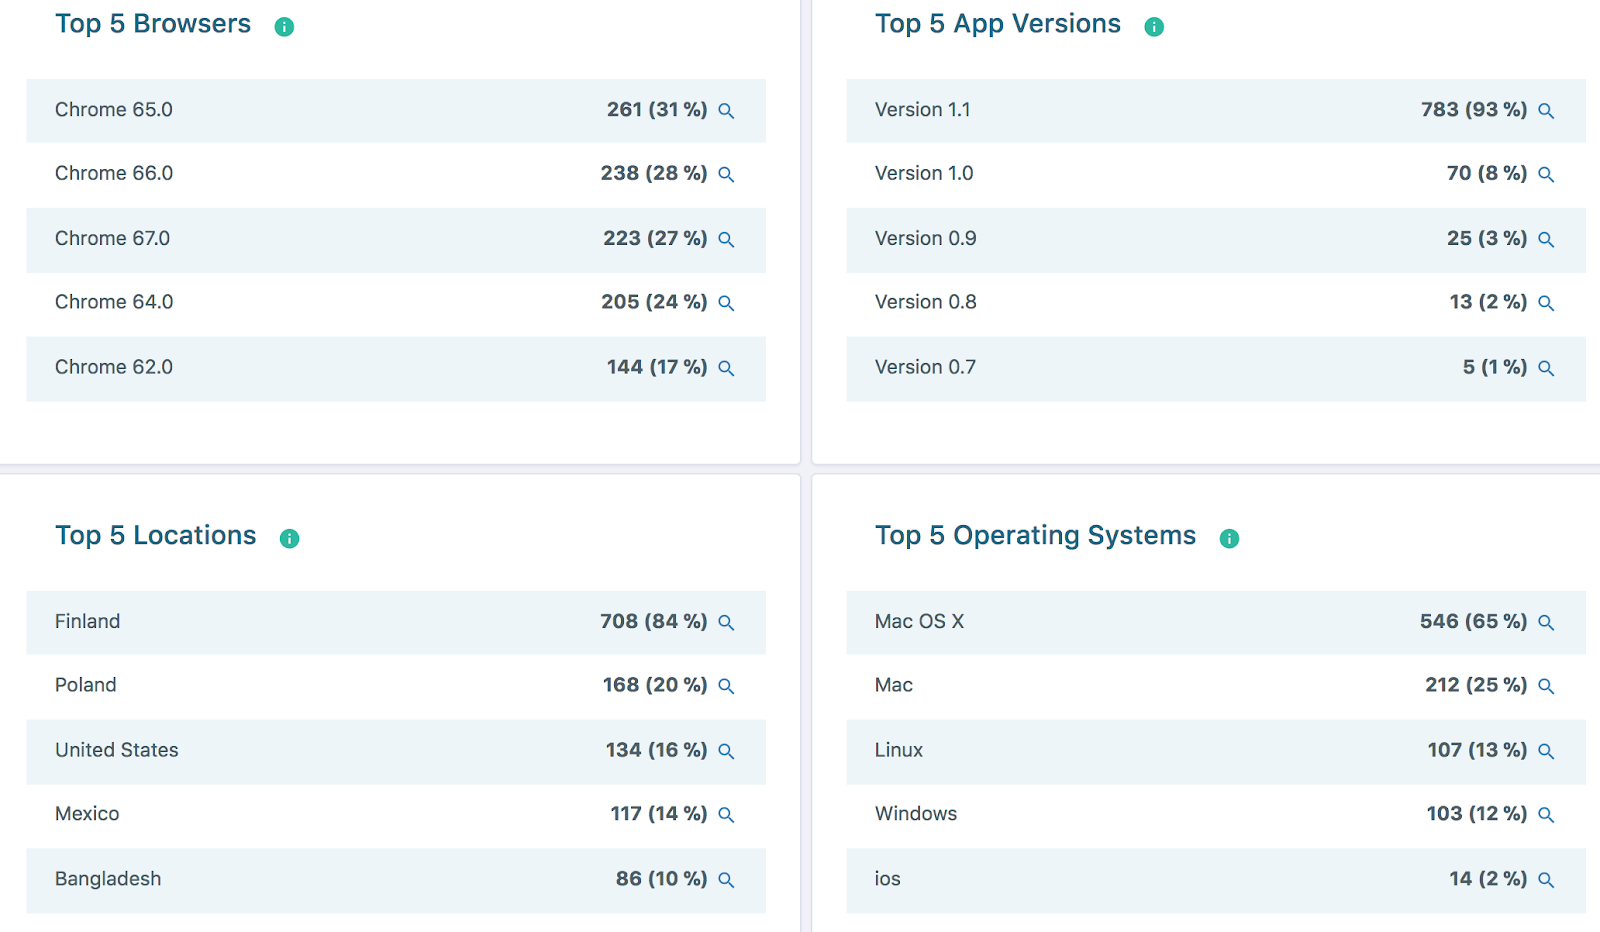
Figure 1: Our new update to the service level metrics can help you identify top 5 app versions, browser versions, locations, and OS versions.
What are the Top 5 Metrics to Help Customers Resolve WebRTC Issues?
- Top 5 App Versions: Shows the number of conferences where a particular app version was used by at least one participant and the percentage.
- Top 5 Browser Versions: Shows the number of conferences where a particular browser version was used by at least one participant and the percentage.
- Top 5 Locations: Shows the number of conferences where at least one participant is from a particular location and the percentage.
- Top 5 OS Versions: Shows the number of conferences where a particular OS version was used by at least one participant and the percentage.
New distributions for existing metrics
To make sure your application behaves as it should and the critical metrics comply with industry standards, you need the distribution of metrics in certain segments. Bearing this in mind, we have now split the critical metrics into several distributions that let you make sure the distribution of a certain metric falls within a specified segment.
For example, round trip time (RTT) is a crucial metric for media quality. We have now split the RTT metric into 3 main distributions:
- RTT less than 150 ms (ideal for real-time communication)
- RTT between 150 - 350 ms (acceptable for real-time communication)
- RTT greater than 350 ms (not ideal for real-time communication)
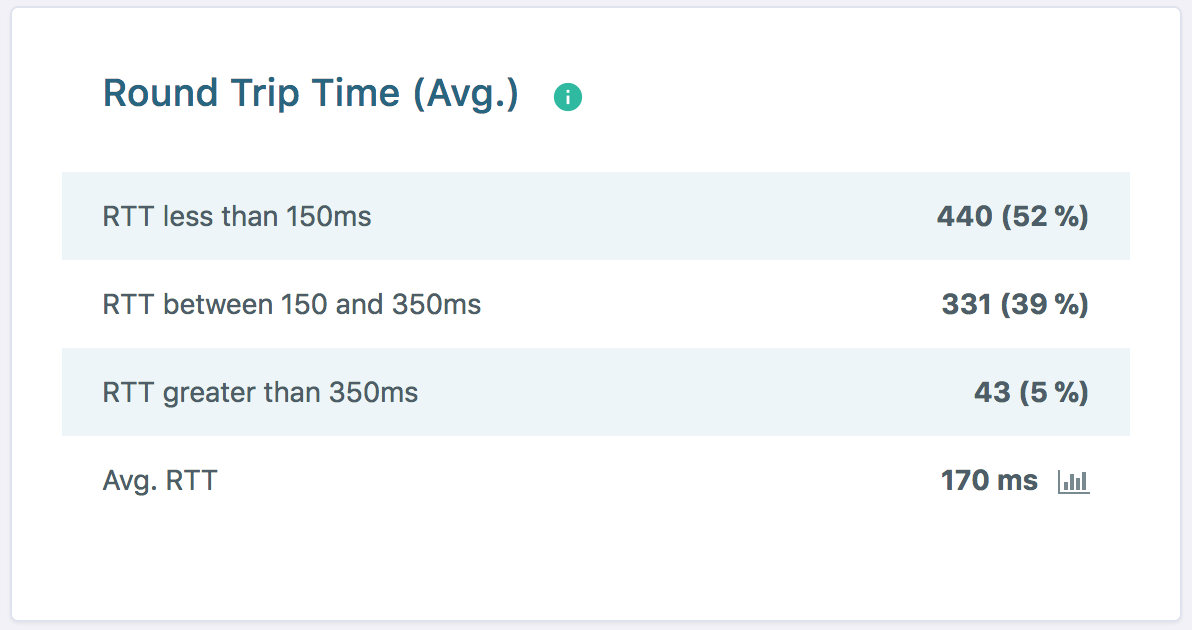
Figure 2: Round trip time distribution example from our dashboard.
Similar distributions are available for many other metrics such as number of participants, conference, duration, setup delay, and audio/video throughput. We will be extending these distributions in the future.
How it Benefits Your Team
As a product owner, you are able to collaborate with engineering and customer support teams to verify and diagnose conference issues with a specific hypothesis . For example, if you assume one of your newly rolled out application versions is affecting your users’ experience with your platform, you can expose those version shares into segments in Top 5 app versions. Once you apply the objective quality filter or user feedback filter, the troublemaker app version can be singled out.
How to Start Using Top 5 Metrics and More Information
If you have been experiencing these sort of problems and don’t know where to start, check out this blog post on the benefits of using callstats.io for WebRTC monitoring.
No account yet? Sign up for an account here to start using Top 5 metrics. For more information, visit our pricing page. or get in touch with our sales team.
callstats.io provides actionable monitoring and product analytics for your WebRTC app. Take a look at how easy it is to quickly integrate callstats.io into your app SDK.